Trusted by Companies


Make your applications more
efficient & cost-effective
Whether during production, deployment, or any stage of the process, implement
Middleware’s Continuous Profiler to optimize code performance at scale.
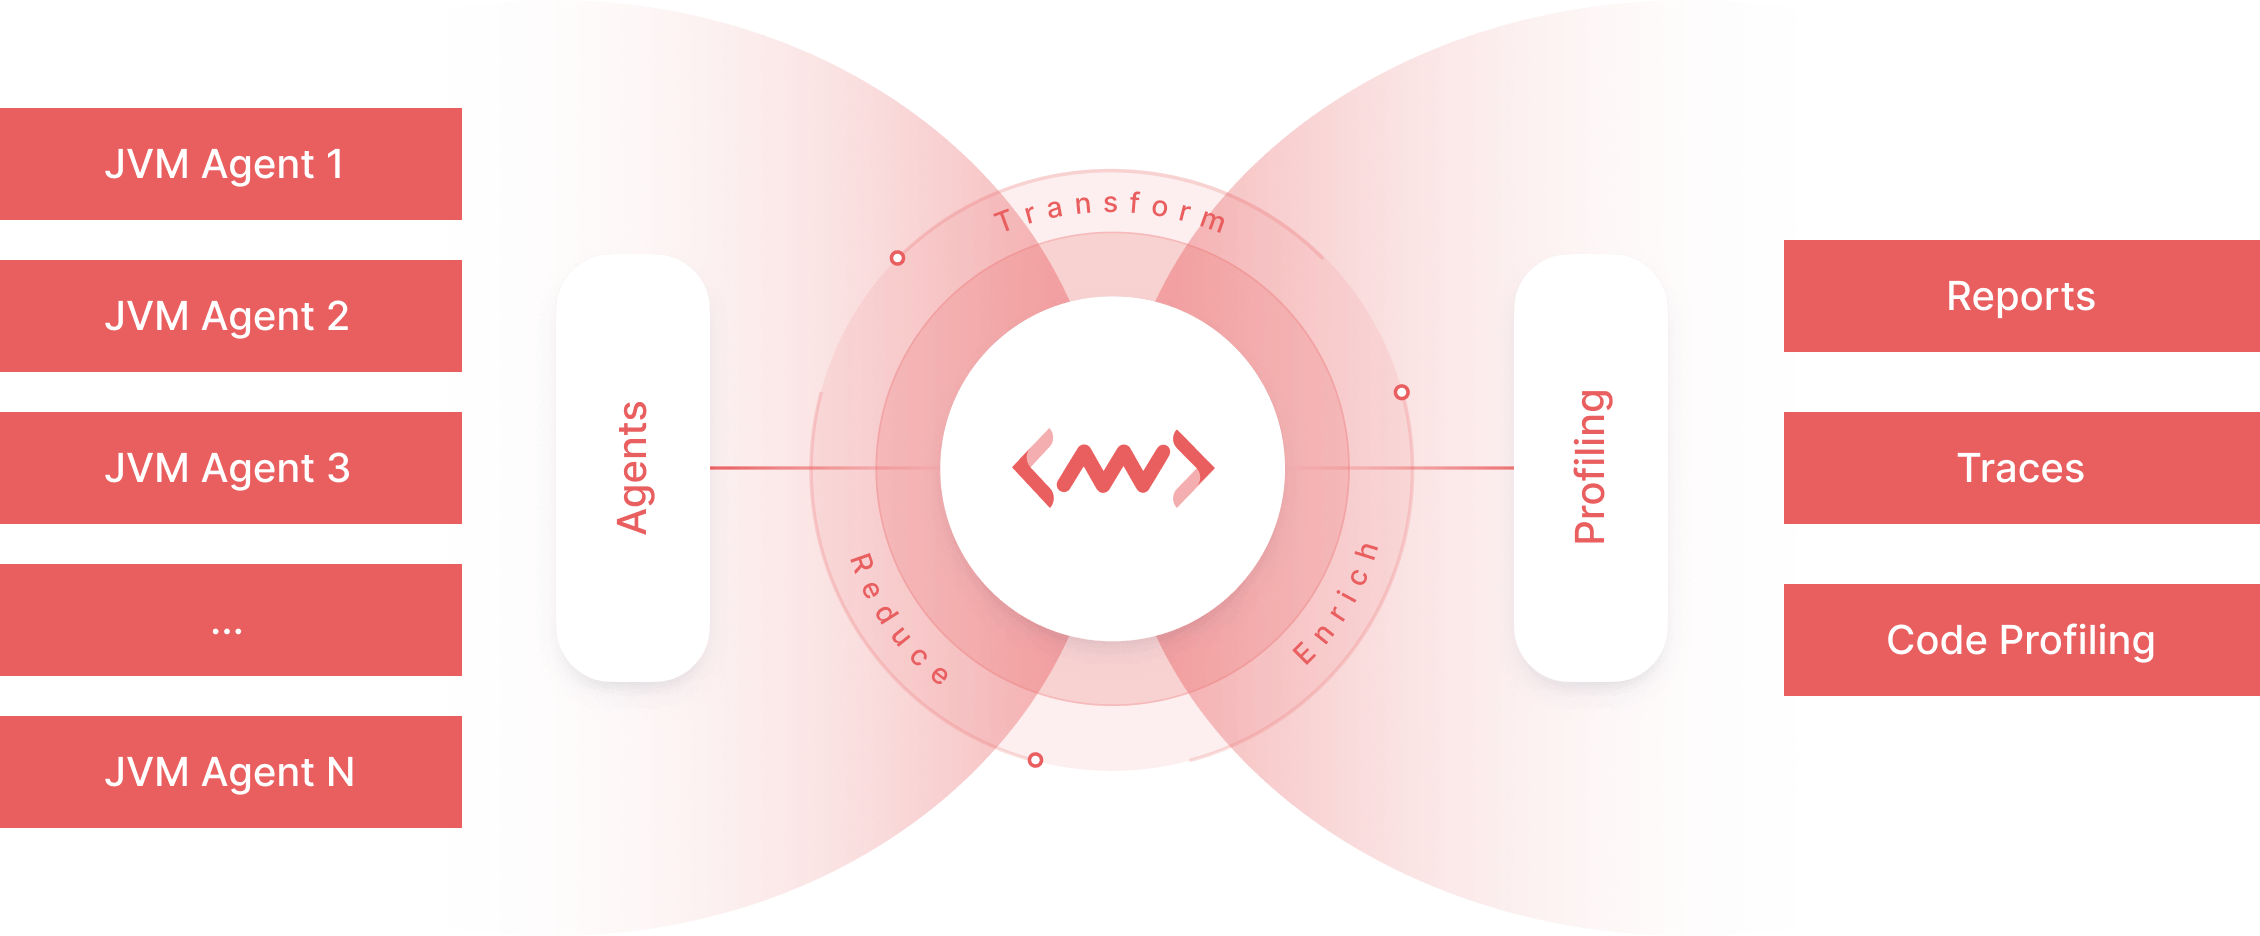
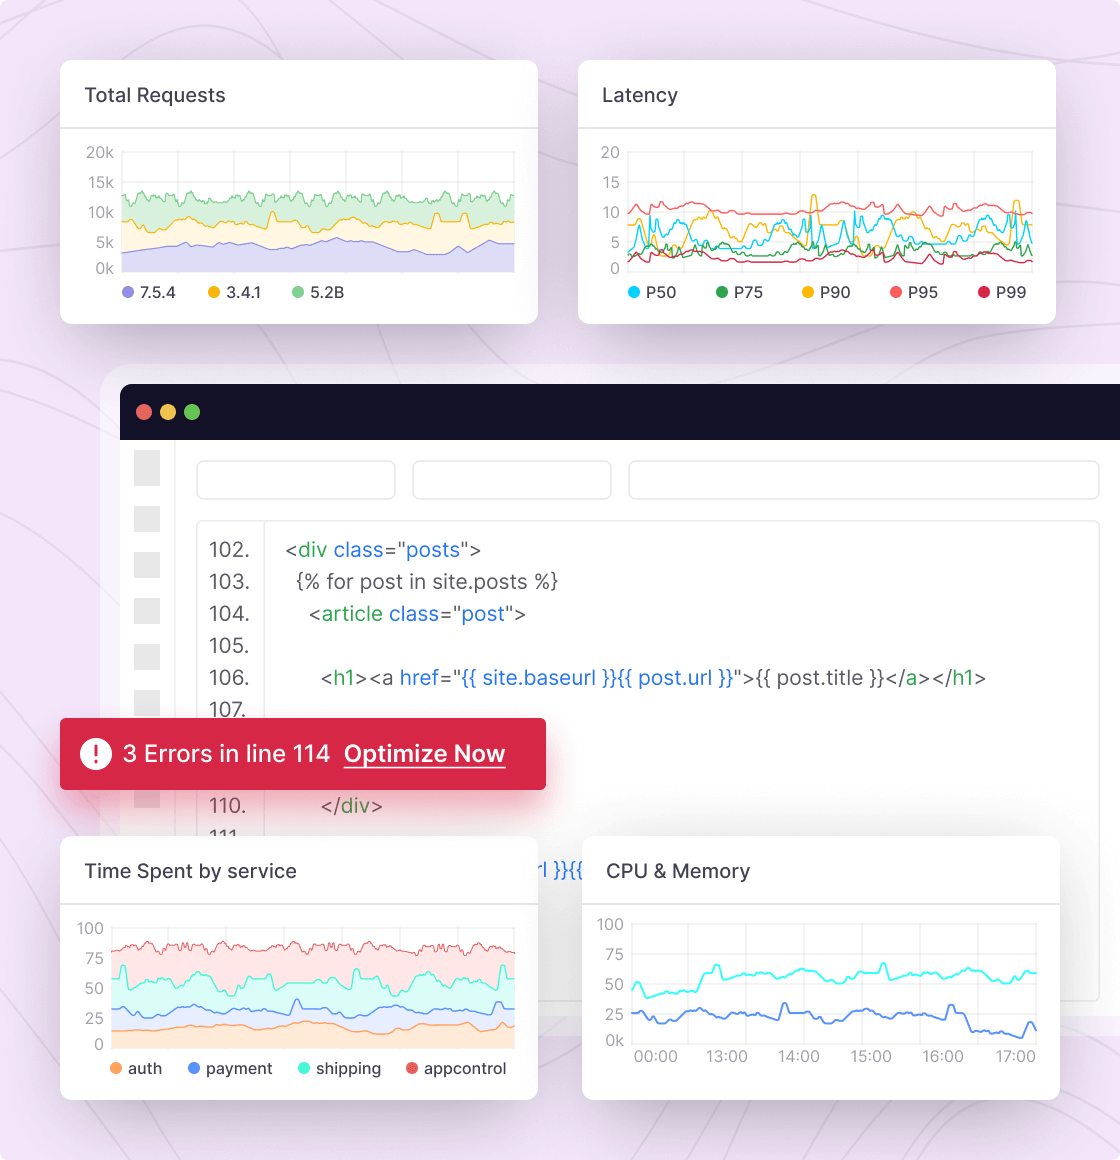
Complete system visibility and context at scale
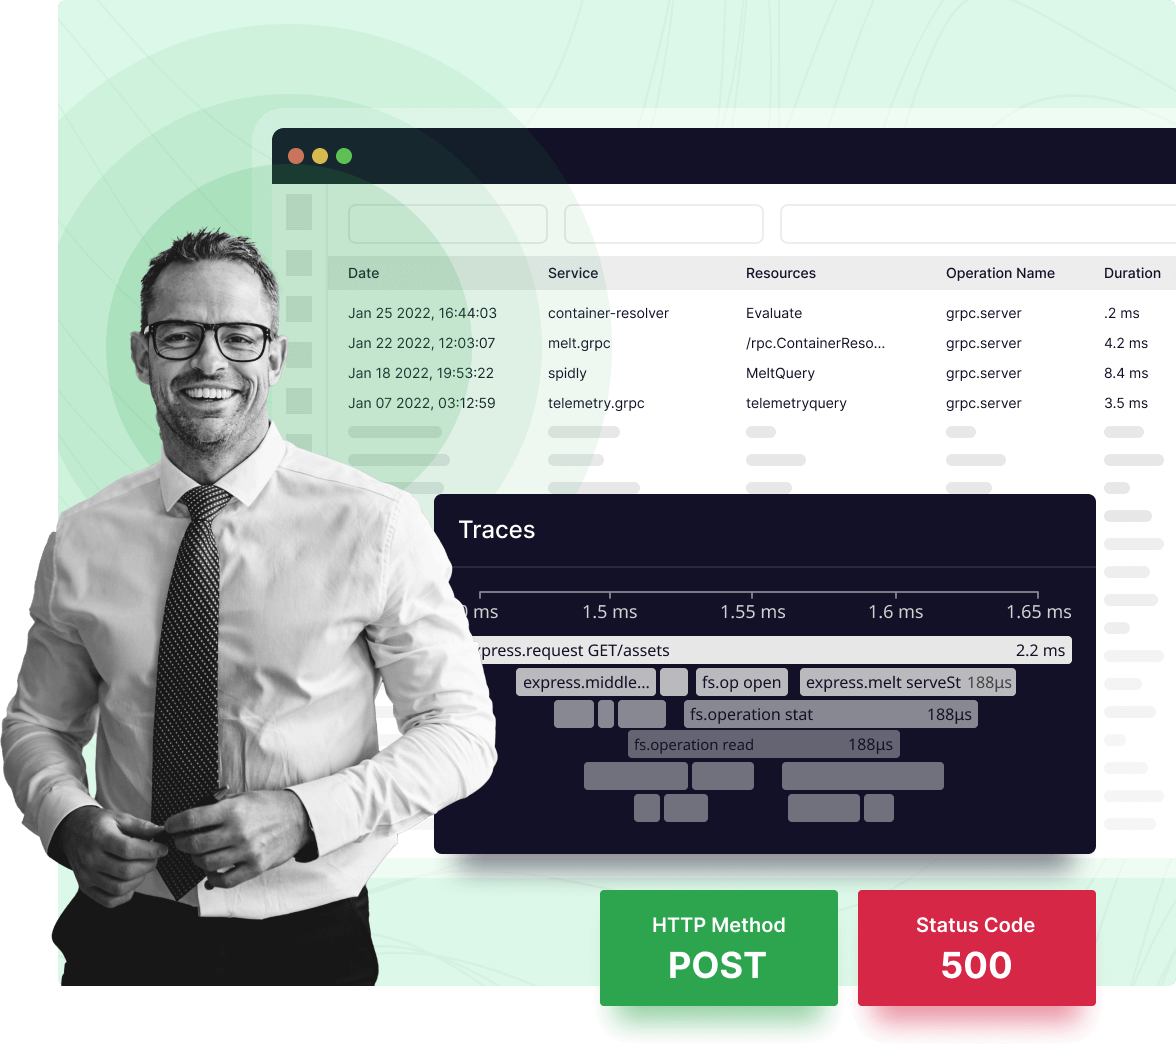
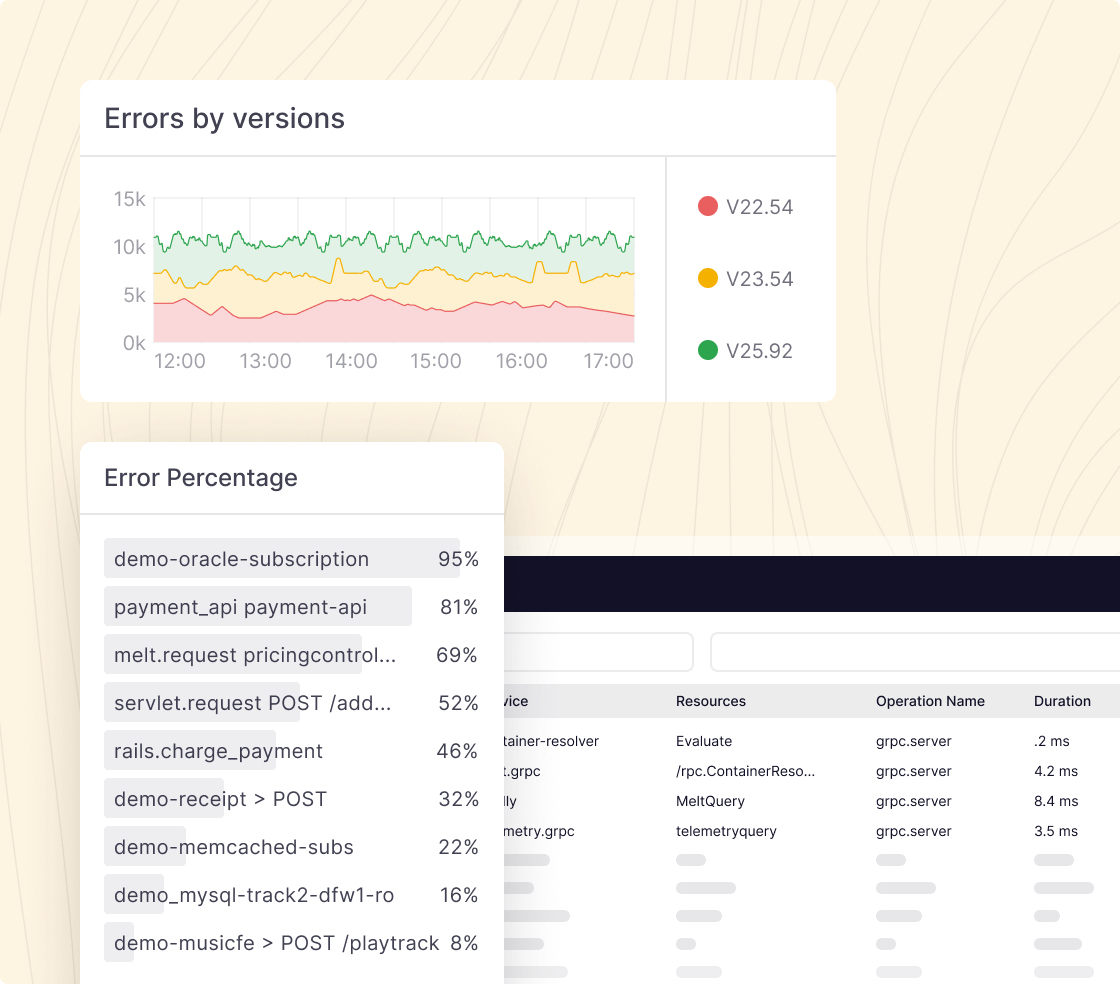
Find and fix errors faster
Reduce downtime, errors, and MTTR by monitoring traces, logs, data, code, and other insights in real time.
Enhance the user experience
Avoid unhappy users and stressed-out engineers with a seamless, automated optimization process.
Reduce cloud provider costs
Cut back on overhead by letting automation and AI analyze and optimize your code across your entire stack.
Identify potential issues in inefficient code
Continuously analyze each line of code through an automated system, maintaining optimal performance and the user experience.
- Identify inefficiencies in production, compare and contrast with pre-production environments
- Augment your cost-reduction efforts through code aggregation across hosts, services, and versions
- Find and fix difficult-to-reproduce errors quickly to reduce downtime and MTTR
Gain visibility into every issue
Integrate your data across your entire infrastructure—from Kubernetes, containers, serverless environments, etc.—so you never miss a problem.
- Optimize methods that may cause issues, bottlenecks, and other problems
- Identify the root cause of issues by breaking down methods and connecting the dots
- Pinpoint every distributed trace and tie to the corresponding method or thread
Eliminate code performance regressions
Compare profiles to examine the routine impact of new code during canary, blue/green, or shadow deploys, and make real-time adjustments to regressions as they arise.
- Reduce resource-heavy methods by identifying error-prone methods and servers
- Identify the root causes of spikes in latency, CPU utilization, memory, and other areas
- Monitor code performance and make adjustments directly from your dashboards
Our top features
Code issue detailing
Catch non-fatal and ANR issues at the source, before they spiral into bigger problems.
Method-level visibility
Provide your developers with the specific information they need to fix the problem.
Full deployment tracking
Automate every stage of deployment and see the impact on performance in real time.
Automated code profiling
Sit back and let Middleware find and optimize your code to maximize application performance.
Enhanced user experience
Simply the observability process with a unified dashboard, detailed filters, automated alerts, and more.
Lower cloud provider costs
Reduce overhead by optimizing your resource load & making adjustments in real time.

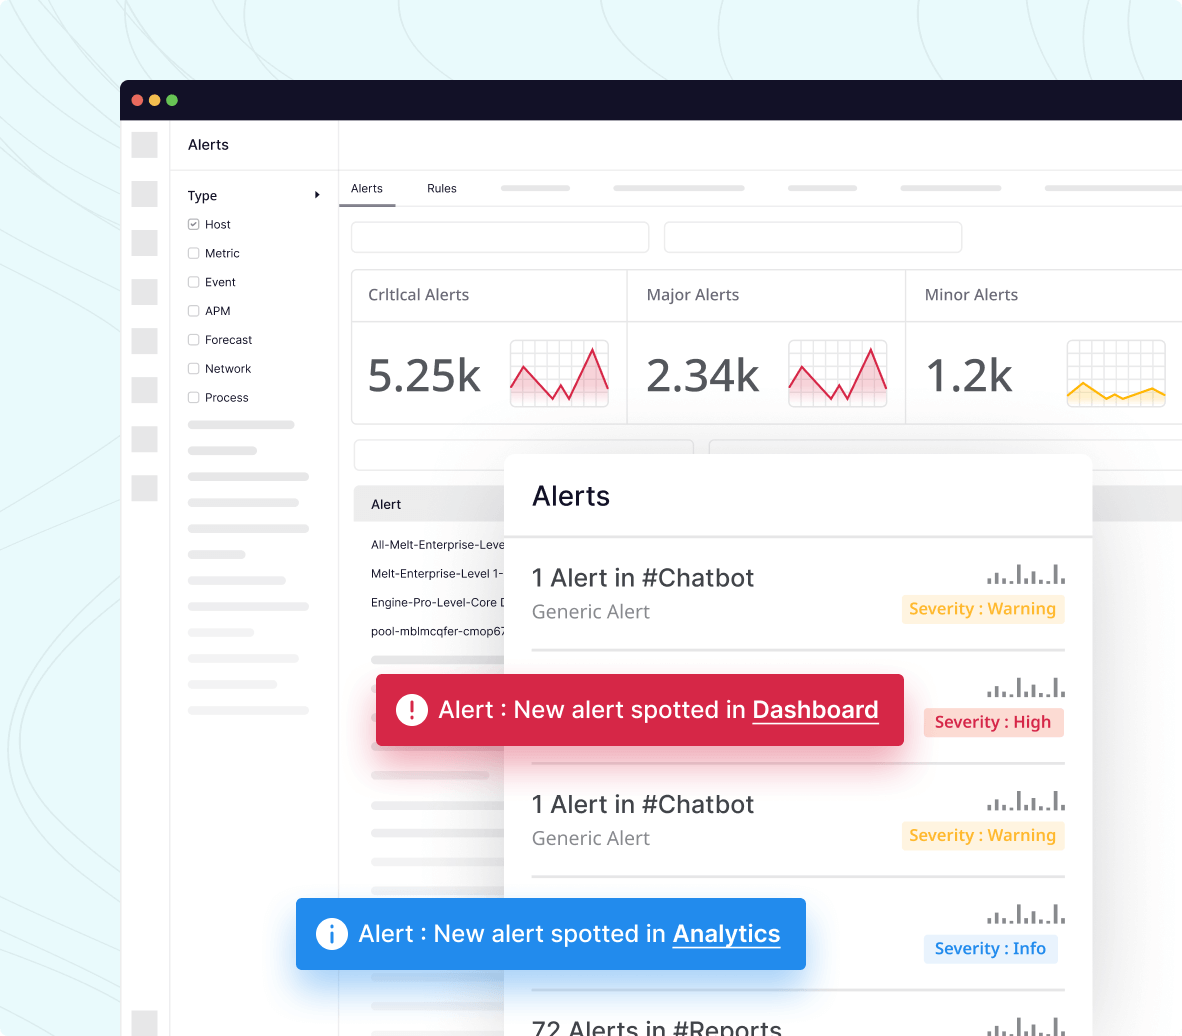
Receive automated insights and alerts
Set up out-of-the-box triggers and alerts within minutes so you never miss an insight across your entire infrastructure.
- Receive suggested application performance suggestions as our AI-powered system uncovers them
- Prevent system issues like memory leaks and deadlocked threads
- Uncover actionable insights that anyone can implement—no coding experience required!