


As a software developer, you are working on a high-traffic application that heavily relies on Redis for caching and real-time data processing.
Unfortunately, you are faced with a Redis server outage that leads to unexpected performance issues. The sudden outage not only disrupts service but also harms your users’ experience.

In this article, we highlight key Redis metrics to monitor that help you prevent performance issues and take proactive steps to optimize your Redis instances. We also mention monitoring solutions that help you monitor all of your key metrics from a single view.
What is Redis?
Redis (Remote Dictionary Server) is an open-source, NoSQL advanced key-value data store that serves as an in-memory data structure. It is well-suited for various use cases, including database, caching, real-time analytics, message brokering, and general-purpose data storage.
Widely used for caching frequently accessed data, Redis reduces the load on primary databases and improves application performance.
Because Redis primarily stores its data in memory, it makes it incredibly fast for read and write operations. Its support for various data structures such as strings, lists, sets, and hashes, makes it flexible and efficient for data storage and manipulation. Redis is highly scalable and allows horizontal scaling for more instances.
Redis persists data to disk, a feature that eases data recovery in the event of a server restart. It also supports publish/subscribe messaging, enabling message brokering and real-time analytics, such as tracking user behavior and managing real-time dashboards.
Many web applications therefore use Redis to store user sessions to quickly access and retrieve session data.
Top 5 Redis metrics to monitor
Despite Redis functionalities and the ability for low latency when working on large numbers of queries, it is still prone to performance bottlenecks in a complex architecture.
Monitoring its key metrics is the only way to get the best out of the Redis deployment and overcome performance issues. The following are key metrics to observe:
1. Performance metrics
Monitoring performance metrics ensures that Redis operates optimally, and provides fast and reliable data access for your applications. The following are Redis performance metrics:
a. Latency:
This metric measures the time it takes for Redis to process a request. Monitoring latency ensures that Redis commands are executing within an acceptable timeframe, thereby preventing slowdowns in application performance.
This is because high latency often leads to delays in data retrieval and system responsiveness. To optimize latency, ensure you understand network latency, disk I/O latency, and Redis server processing time.
This understanding will help you fine-tune Redis configuration, data layout, and the system architecture to minimize delays in data access.
You can access the Redis server using the Redis command-line interface, “redis-cli”. For Redis latency, you can run the following command:
Replace `<host>`, `<port>`, `<db_number>`, and `<password>` with your Redis server’s actual values.
A result like the below will be returned:
In this example, the result shows the minimum latency, maximum latency, average latency, and the number of samples collected. This information shows the performance of the Redis server in terms of response time.
But when external monitoring tools are used, you’ll capture and analyze latency metrics over time without running commands.
b. CPU usage:
CPU usage represents the amount of processing power that Redis consumes. High CPU usage indicates heavy computational load or inefficient resource utilization. Monitoring CPU usage provides insight into the server’s workload and helps you identify resource constraints.
When you understand the CPU usage patterns, it enables effective capacity planning. Overtime monitoring of CPU usage helps you assess load trends, predict scaling needs, and implement optimizations to maximize CPU utilization.
c. Hit rate:
The hit rate measures the percentage of successful key lookups in Redis’ cache, compared to overall lookups, indicating the effectiveness of caching strategies. While a high hit rate signifies efficient cache utilization, a low hit rate points to suboptimal caching, prompting a reevaluation of caching strategies and data access patterns.
The hit rate can be calculated using formulas based on the number of cache hits and misses, or by leveraging other Redis metrics for cache utilization and hit ratio. Monitoring and analyzing hit rates help you refine caching strategies, adjust cache sizes, and fine-tune data access patterns.
2. Memory metrics
Monitoring memory metrics is crucial for maintaining optimal memory utilization, and proactive management of memory resources. The metrics are as follows:
a. Memory usage:
Memory usage refers to the amount of physical memory consumed by Redis to store data and metadata. High memory usage results in out-of-memory errors, performance degradation, and even server crashes. You can monitor memory usage through Redis commands such as `MEMORY USAGE` and by examining the “used_memory” metric from the INFO command.
b. Memory fragmentation ratio:
Memory fragmentation occurs when memory is allocated and deallocated, which results in fragmented memory blocks and inefficiencies. The memory fragmentation ratio measures the degree of fragmentation within Redis and reflects how fragmented the memory allocation has become.
High fragmentation often leads to inefficiency in memory usage, and slower responses. You can monitor the memory fragmentation ratio by calculating the ratio of memory used to memory allocated.
However, Redis provides limited visibility into this metric through native commands. Specialized tools such as Middleware are therefore required to gain a deeper understanding of the metric.
c. Key evictions:
This metric tracks the rate at which keys are evicted from the Redis cache due to memory constraints. Key evictions occur when Redis needs to free memory and removes keys according to its configured eviction policy. Monitoring key evictions helps you understand the impact of memory limits and management on the dataset and system.
This helps you determine if the eviction policy needs adjustment or if additional memory resources are required. You can monitor key evictions by periodically querying the “evicted_keys” metric from the INFO command and assessing the eviction rate over time.
However, with monitoring tools, you will gain historical data on key eviction patterns and their impact on Redis performance.
3. Basic activity metrics
Monitoring basic activity metrics helps ensure the stability, scalability, and reliability of the Redis deployment. The following are the metrics within the basic activity metrics:
a. Connected clients:
This metric monitors the number of clients connected to the Redis server. High numbers of connected clients increase the server load and may impact responsiveness.
You can retrieve the count of connected clients using the INFO command. By monitoring this metric, you’ll identify usage patterns, peak connection times, and client connection limit issues.
b. Connected slaves:
This tracks the number of slave instances connected to the Redis master server, providing insights into replication status and issues related to the slave nodes. It also helps you understand the load on the master server.
Sudden drops in the number of connected slaves or inconsistencies in replication can be quickly identified through this metric. You can retrieve the count of connected slaves using the INFO command.
And you need to monitor changes over time to ensure that replication is functioning as expected.
c. Master_last_io_seconds_ago:
This metric indicates the time elapsed since the last interaction with the master node for each connected replica. Monitoring this metric helps you assess the liveness of the master node.
Observing an increasing value for “master_last_io_seconds_ago” could indicate potential replication issues or network connectivity problems. You can access the “master_last_io_seconds_ago” metric through the INFO command for each connected replica and set up alerting mechanisms to identify anomalies.
d. Keyspace:
The “keyspace” metric provides information about the number of keys in each defined keyspace, along with additional metadata such as expiration details. Monitoring the keyspace metric offers insights into the distribution of data across different key spaces.
You can retrieve information about the keyspace using the INFO command. This allows you to analyze the distribution of keys, assess expiration patterns, and plan for data sharding or partitioning.
4. Error metrics
Error metrics in Redis encompass a wide range of issues including command failures, connection errors, and other unexpected behavior within the Redis environment. Monitoring and understanding these metrics help you maintain system reliability and performance.
From a technical standpoint, to detect and address error metrics, you’ll need to regularly review Redis logs to identify various errors, warnings, and exceptions that may impact the system’s stability.
You’ll also need to leverage Redis’ built-in error reporting which provides detailed error messages for various operations. This enables you to diagnose and rectify issues proactively.
5. Expired/Evicted keys
Keeping track of the number of expired and evicted keys helps you gauge the efficiency of the key eviction policy and assess the impact of key expiration on system performance.
You can monitor the number of expired keys and the frequency of expiration using Redis commands, such as `TTL` and `PTTL`, and by analyzing the expiration metadata for keys. Understanding expiration patterns allows you to properly optimize data retention and caching strategies.
This ensures that expired data does not linger unnecessarily in the system.
Evicted keys represent data removed from the Redis cache due to memory constraints and its configured eviction policy. To monitor key eviction rates and patterns, use the “evicted_keys” metric from the INFO command. External monitoring tools will however provide deeper and detailed analysis of the metric.
Analyzing this metric enables you to assess the impact of memory management on the dataset and adjust eviction policies as needed to maximize cache efficiency.
Redis performance monitoring: 3 options
Each of the following options offers a unique approach to Redis performance monitoring, providing you with the functionalities and insights needed to optimize the performance of your Redis deployments.
1. Using tools like Middleware
Middleware is a full-stack cloud observability platform, offering intuitive dashboards for holistic insights and streamlined data analysis for various applications and databases, including Redis. The platform also offers a dedicated database monitoring section where you can find detailed view and data for database performance
Seamlessly integrated with Redis, it automatically collects performance metrics and presents them within a centralized dashboard. The customizable dashboard empowers you to tailor the visualizations to your specific needs.
Middleware also offers a smart alert system equipped with algorithms for root cause analysis. You can configure alerts to trigger anomaly detection and receive notifications when specific thresholds are exceeded.
This proactive approach enables swift identification and resolution of issues across Redis instances, ensuring optimal system performance.
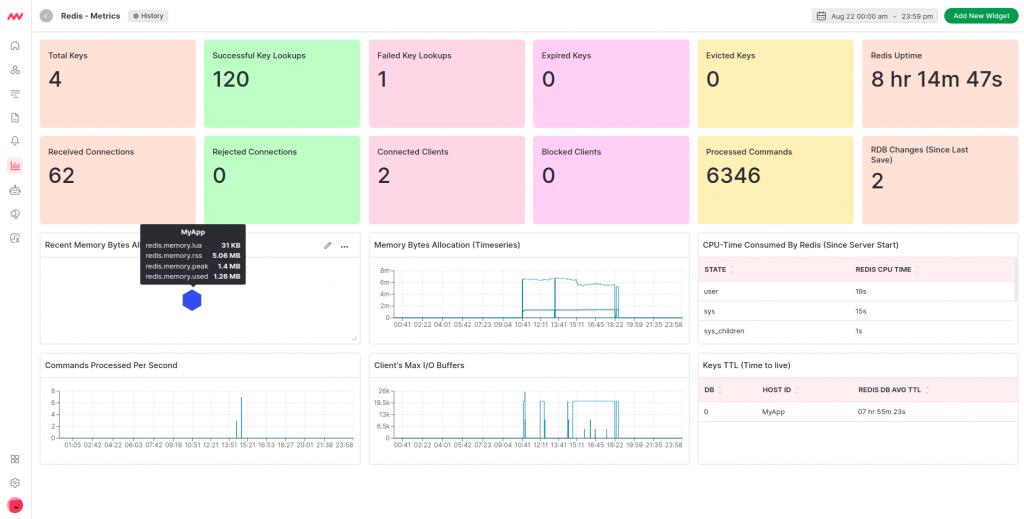
Middleware supports all the key Redis metrics including but not limited to redis.cpu.time, redis.clients.connected, redis.keys.expired, redis.keys.evicted, redis.memory.peak, redis.keyspace.hits, redis.replication.offset, and redis.memory.fragmentation_ratio.
While offering correlation of metrics for in-depth analysis, Middleware also provides a causation-to-correlation feature that spots when an issue begins and where it ends.
2. Redis enterprise built-in monitoring capabilities
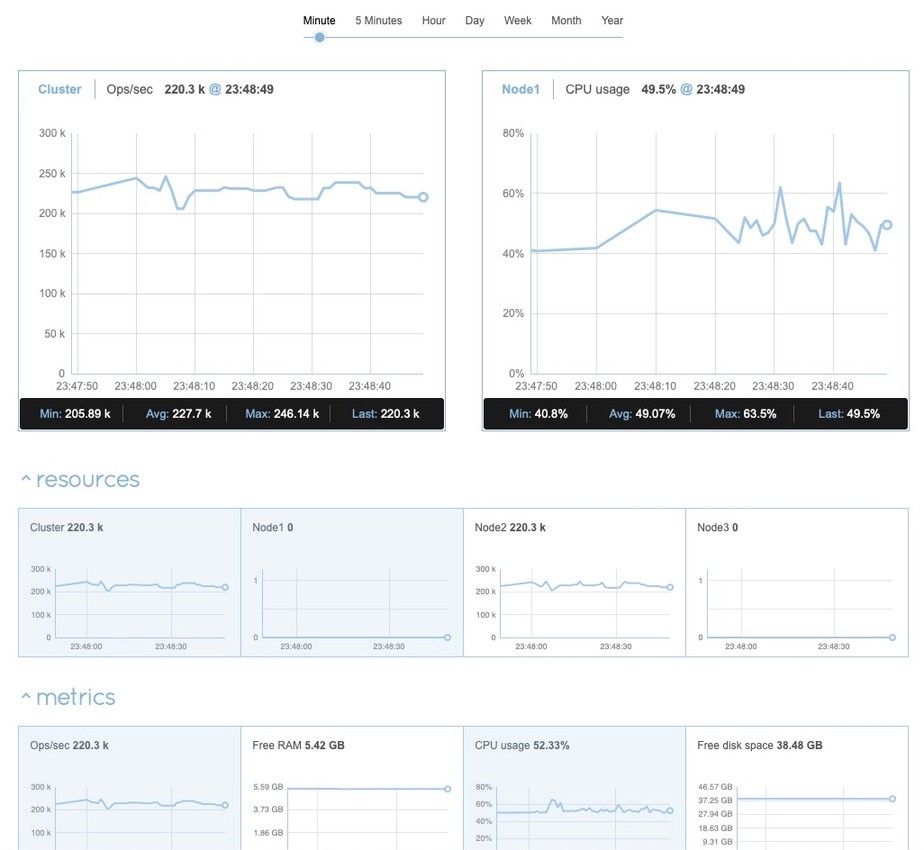
The built-in monitoring capability for Redis is the Redis Enterprise cluster management UI monitoring console. It does not require any configuration or installation efforts since it is built-in.
With the “minute” interval, Redis monitoring console works almost real time. Its interface represents a comprehensive dashboard that provides metrics for the cluster, its nodes, and databases, on separate screens.
The Redis Enterprise monitoring console also has an alert system that allows you to set alerts for each metric, and to configure these notifications to be sent by email. Note however that the Redis Enterprise monitoring console is only available for Enterprise users of Redis, and not the open-source users.
3. REST API
Redis provides a REST API that allows users to programmatically retrieve performance metrics and operational data from the Redis server. The REST API offers a flexible and convenient way to integrate Redis monitoring with custom solutions or third-party tools.
This enables seamless incorporation of Redis telemetry and operational functionality within the broader IT ecosystem. By leveraging the REST API, you can query for specific metrics and integrate them into third-party tools. REST API is also available only for Redis Enterprise users.
Conclusion
While it is a great asset to know and understand key Redis metrics to observe, it would not be worth the effort when you do not have the right monitoring tool at your disposal.
One such tool is Middleware, which offers a comprehensive solution for Redis, capturing vital metrics and providing features that aid analysis.
So, why are you waiting? Sign up to Middleware for free and embrace the true potential of Redis monitoring.