Looking for the best observability tools in 2024?
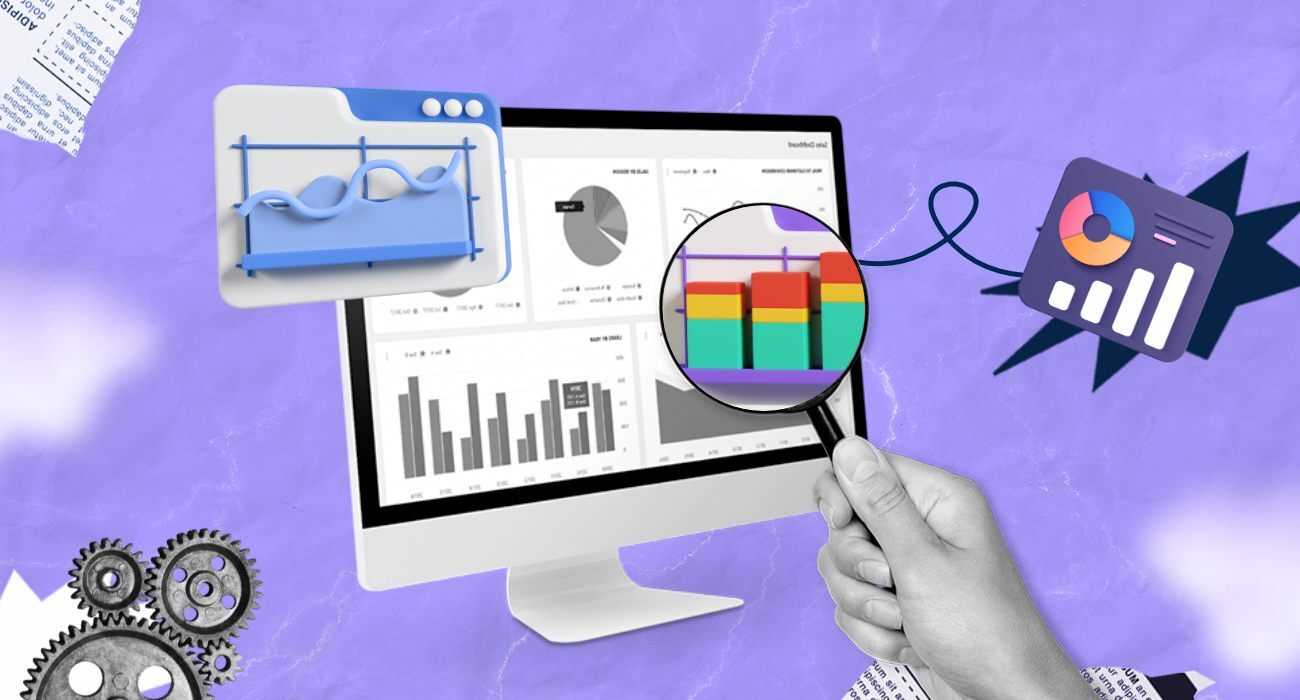
Observability is vital for any modern enterprise, especially since we are now producing and handling more data and applications than ever before. Along those lines, observability helps you understand what is happening within your systems, helping you take proactive steps to mitigate any risks and ensure that your systems keep running smoothly.
However, as the demand for observability has intensified, several data observability tools are now available. According to forecasts, observability tools are projected to have a market share of USD 4.1 billion by 2028.
Choosing the right tool among the options available is all about looking into aspects like scalability, agility, and the tool’s unique features that can help you address your specific DevOps needs.
To help you make this decision, here is a look at what precisely observability tools are and why they are essential. We will also delve into the top observability tools in 2024, comparing the features, benefits, and pricing of each tool to help you make the right choice.
What are observability tools?
Observability helps businesses and DevOps teams assess their system’s current state based on multiple metrics. In simpler terms, it’s about gaining insight into how a system behaves and performs from the outside looking in. It uses three core pillars for this process:
- Metrics to measure key performance indicators (KPIs) such as CPU utilization or average write latency to persistent storage.
- Logs are records of individual events in a system, such as the start of a subprocess or the trapping of an error.
- Traces help analyze request flows and operations encoded with microservices data, identify services causing issues, and suggest areas of improvement.
Observability tools are pivotal in enabling end-to-end surveillance, offering organizations a comprehensive means to monitor, analyze, and troubleshoot complex systems and applications.
Unlike traditional monitoring solutions that may only present surface-level metrics or alerts, observability tools provide deeper visibility into the underlying factors influencing system behavior.
This contextual information is essential for understanding the root cause of issues and making informed decisions about addressing them.
Observability Tools vs Observability Platform
When it comes to observability, the terms “observability tools” and “observability platforms” are often used interchangeably, but they represent distinct concepts within the monitoring landscape. Here is a look at their distinctions:
| Parameters | Observability Tools | Observability Platforms |
| Focus | Monitor specific aspects of the system or application | Provide end-to-end visibility across the IT stack |
| Functionality | Tailored to specific use cases or technology stack | Integrates multiple tools and data sources |
| Scope | Narrow, deep insights into specific components | Broad, comprehensive view of the entire infrastructure |
| Integration | Standalone solutions | Unified platform |
| Data Sources | Metrics, logs, traces, events | Metrics, logs, traces, events |
| Capabilities | Deep insights, specialized functionality | Correlation, cross-cutting analysis, holistic view |
| Use Cases | Metrics monitoring, log management, APM | Comprehensive observability, troubleshooting |
Top 10 Observability Tools
Middleware
Middleware is a full-stack observability platform that made it’s way in our list of observability tools because of it’s unique market positioning of the ability to use just only the features you need and be charged only for it and not others.
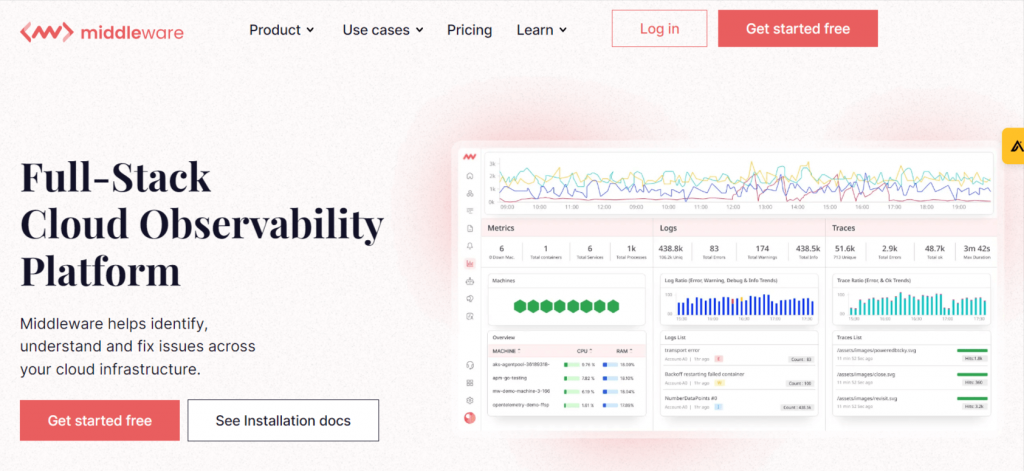
The platform integrates, aggregates, and analyzes data from multiple sources, creating logs, traces, and monitoring metrics to help organizations better understand their infrastructure, applications, and systems.
Middleware takes an end-to-end approach to observability, offering a long list of monitoring tools for your infrastructure, logs, application performance, APIs, database, serverless applications, containers, and real users.
Depending on your requirements, you can deploy the platform to use all of its capabilities or even a single one.
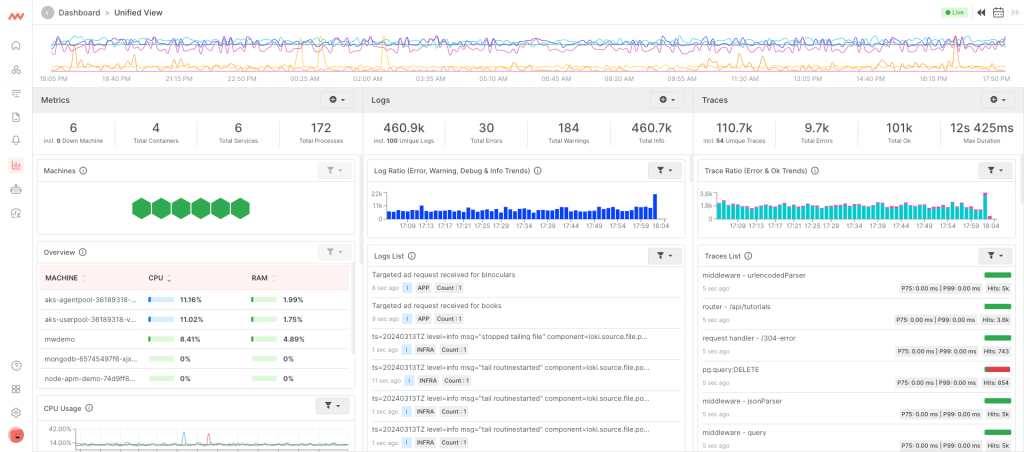
i. Unified monitoring
Middleware provides a unified view of metrics, logs, and traces, consolidating data from multiple sources into a single platform for easy analysis and troubleshooting.
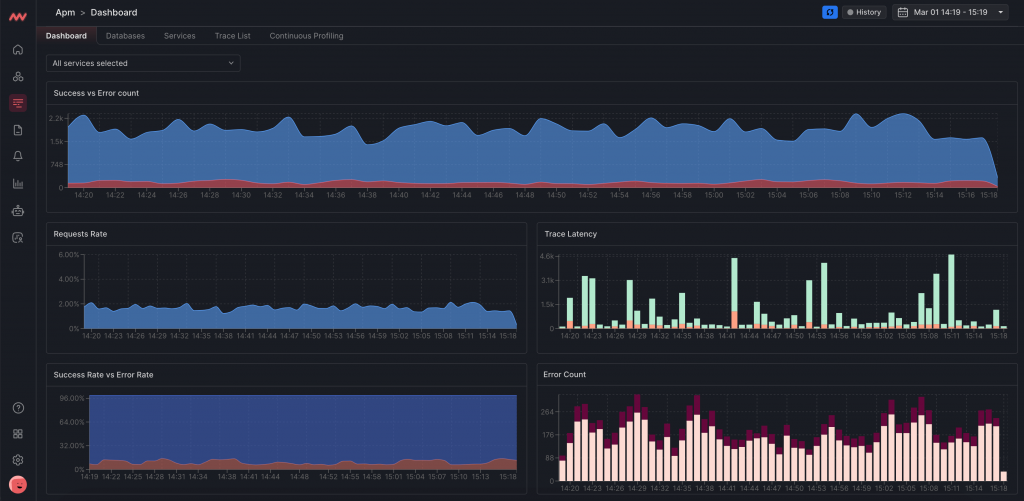
ii. APM dashboard
Middle also provides a powerful Application Performance Monitoring (APM) dashboard that lets you gain real-time insights into distributed traces and correlate them with other observability data.
To maximize performance, you can connect these traces to several infrastructure logs, processes, and metrics like app usage patterns, response times, error rates, and more.
The metrics screen offers comprehensive monitoring of system and application metrics, with customizable graphs and visualizations to track performance over time.
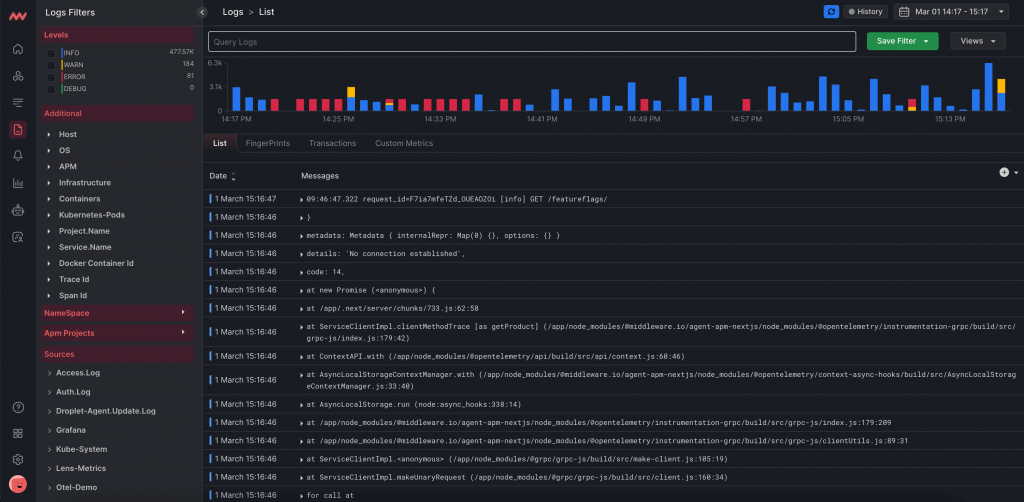
iii. End-to-end visibility into logs
The logs dashboard provides a centralized hub for monitoring and analyzing log data, with powerful search and filtering capabilities for efficient troubleshooting.
This enables distributed tracing across microservices architectures, providing end-to-end visibility into request flows and performance bottlenecks.
iv. Default and custom dashboards
Users can create custom dashboards tailored to their specific needs, allowing them to visualize important metrics and gain insights into the performance of applications and infrastructure.
v. Flexible pricing with pay-as-you-go model
Although not a technical feature, Middleware also provides you with the benefits of an observability platform at the price of a traditional observability tool.
The platform allows you to pick the features and services you need – whether it is logs, APMs, servers, or all services combined, and pay for your actual usage.
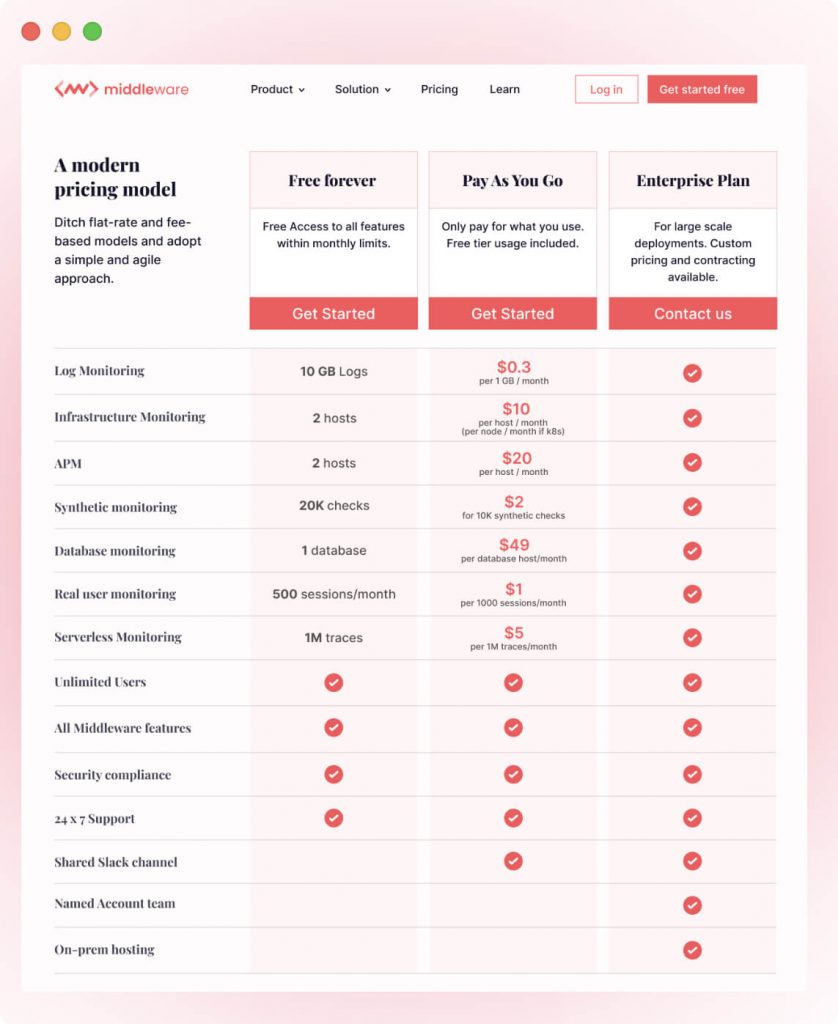
Pricing
- Free forever – Free plans for APM, Log and Infrastructure monitoring, RUM, Synthetic monitoring, Database, and Serverless monitoring.
- Pay-as-you-go – Log monitoring starts at $0.3/ 1GB / month, Infrastructure monitoring $10/ host/month, APM $20/ host /month, Synthetic monitoring $2 for 10K synthetic checks, Database monitoring $49 per database host/month, RUM $1/ 1000 sessions/month, and Serverless monitoring $5/ 1M traces/month.
- Enterprise Plan – Ideal for large scale deployments. Custom pricing and contracting available.
Pros
- Middleware provides a simplified installation and setup process.
- AI-driven anomaly detection is also provided for proactive issue resolution.
- Customizable dashboards is an added bonus along with alerts tailored to specific use cases.
- Scalable architecture that is capable of handling large volumes of data.
- Also provided is a flexible pricing model based on actual usage, providing you with an end-to-end observability platform at the price of an observability tool.
Cons
- A somewhat slight learning curve exists for advanced features and configuration.
- Users may need additional support or training to leverage the platform’s capabilities that extend beyond just a normal observability or monitoring tool.
Try the free forever account. To observe your systems, applications and more!
Datadog
Datadog is a cloud-scale monitoring and analytics platform that provides comprehensive observability across modern cloud-native environments. Datadog also offers real-time insights into metrics, logs, traces, and events, allowing organizations to gain deep visibility into their infrastructure and applications.
Key features
- Centralized monitoring of metrics, logs, traces, and events for holistic observability.
- Custom alerting for issues in infrastructure, applications, or services.
- Extensive integrations with CI/CD platforms, notification systems, and collaboration tools.
- Support monitoring of cloud services, containers, and microservices architectures.
Datadog Pricing
- Free plan.
- Pro – Starting at $15.
- Enterprise – Starting at $23.
- DevSecOps Pro – Starting $22.
- DevSecOps Enterprise – Starting $34.
Pros
- User-friendly interface with intuitive navigation and dashboard customization options.
- Robust alerting and visualization features enable users to identify and respond to performance issues quickly.
- Scalable architecture capable of handling large volumes of data, making it suitable for enterprises and high-traffic applications.
Cons
- Pricing may be prohibitive for small to medium-sized organizations, especially those with large data volumes.
- Some users may find the documentation lacking detail, leading to challenges in implementing complex monitoring setups without external assistance.
ServiceNow cloud observability – Lightstep
Lightstep is a cloud observability documentation tool that is part of ServieNow’s Cloud Observability solution. It provides deep insights into the performance of microservices-based architectures.
Leveraging distributed tracing, Lightstep enables organizations to easily gain visibility into complex distributed systems and troubleshoot performance issues.
Key features
- Distributed tracing capabilities for end-to-end visibility into microservices architectures.
- Anomaly detection and root cause analysis feature for proactive performance monitoring and troubleshooting.
- Real-time collaboration features allow teams to work together on troubleshooting and issue resolution.
Pricing
- Teams Edition: $100 per month.
- Enterprise Edition: Custom pricing.
Pros:
- Service-level objective (SLO) monitoring ensures that applications meet performance targets, helping organizations maintain a high level of service reliability.
Cons:
- Limited support for non-microservices architectures may restrict the applicability of Lightstep to specific use cases.
- Advanced features such as distributed tracing and anomaly detection may require additional configuration and setup, potentially increasing implementation time and complexity.
Dynatrace
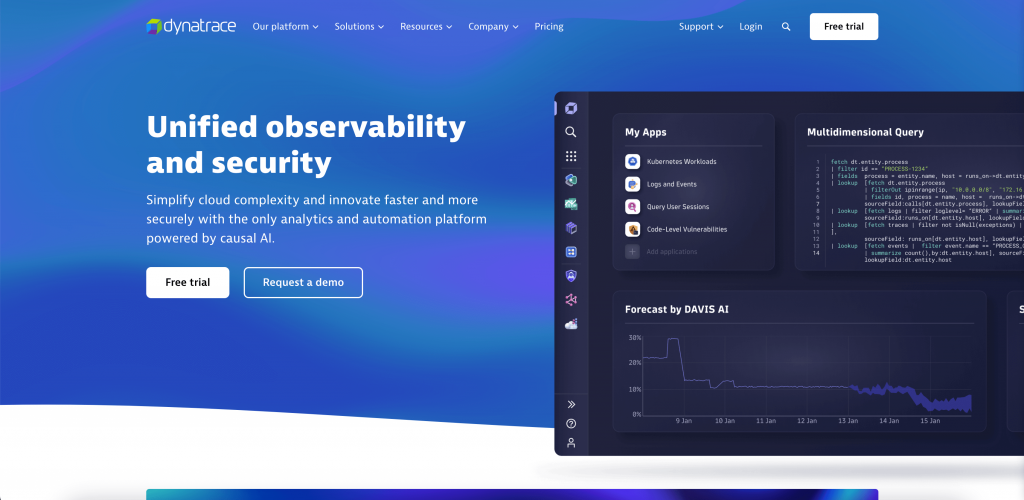
Dynatrace is an AI-powered observability platform that provides automatic and intelligent monitoring for cloud-native environments. With its comprehensive suite of monitoring and analytics tools, Dynatrace enables organizations to gain deep insights into the performance and reliability of their systems and applications.
Key features
- Automatic detection and remediation to help remediate performance issues, ensuring the continuous optimization of cloud-native environments and enhancing user experience.
- Integrates with many cloud platforms and third-party tools, ensuring compatibility with diverse environments and workflows.
Pricing
No platform fees. Pay as you need for Full-stack monitoring, infrastructure monitoring, Kubernetes monitoring, Application security, real user monitoring, synthetic monitoring, log management, and analytics.
Pros
- AI-driven root cause analysis automates the detection and resolution of performance issues, reducing manual effort and enabling proactive problem-solving.
- Full-stack monitoring capabilities provide comprehensive visibility into the entire IT stack, from infrastructure to applications, enabling end-to-end performance management.
Cons
- Complex setup and configuration may require additional time and resources to implement effectively, potentially increasing the time to value for new users.
Grafana
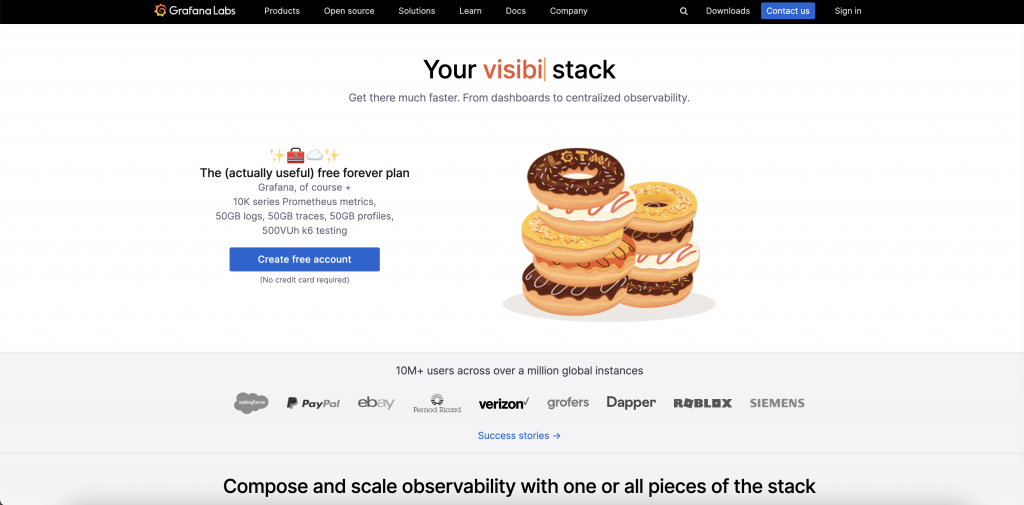
Grafana is an open-source observability platform that offers flexible visualization and analytics capabilities for metrics, logs, and traces. With it’s LGTM stack and its extensive plugin ecosystem and customizable dashboard options, Grafana empowers users to create tailored monitoring solutions that suit their specific needs and preferences.
Key features
- Flexible visualization provides a wide range of visualization options, including charts, graphs, and dashboards, enabling users to create customized monitoring solutions.
- Supports a wide range of data sources and integrations, allowing users to collect and analyze data from diverse sources and technologies.
- Offers customizable dashboard options, allowing users to create personalized monitoring views that provide actionable insights at a glance.
Pricing
- Free forever account.
- Pro: $0 for the base platform, with usage-based pricing for metrics, visualizations, logs, traces, profiles, and more.
- Advanced: $299 per month + additional cost for usage-based features like metrics, visualization, logs, traces, profiles, etc.
Pros
- Open-source and customizable platform allows flexibility and extensibility, empowering users to tailor the tool to their specific needs and preferences.
- Active community support and documentation resources provide valuable assistance and guidance for users, making it easier to get started and troubleshoot issues.
Cons
- While the platform offers extensive customization options, some users may find the learning curve steep, particularly for complex configurations or advanced features.
- As an open-source project, Grafana may lack some of the advanced capabilities and support options available with commercial observability platforms, potentially limiting its suitability for enterprise-scale deployments.
Honeycomb
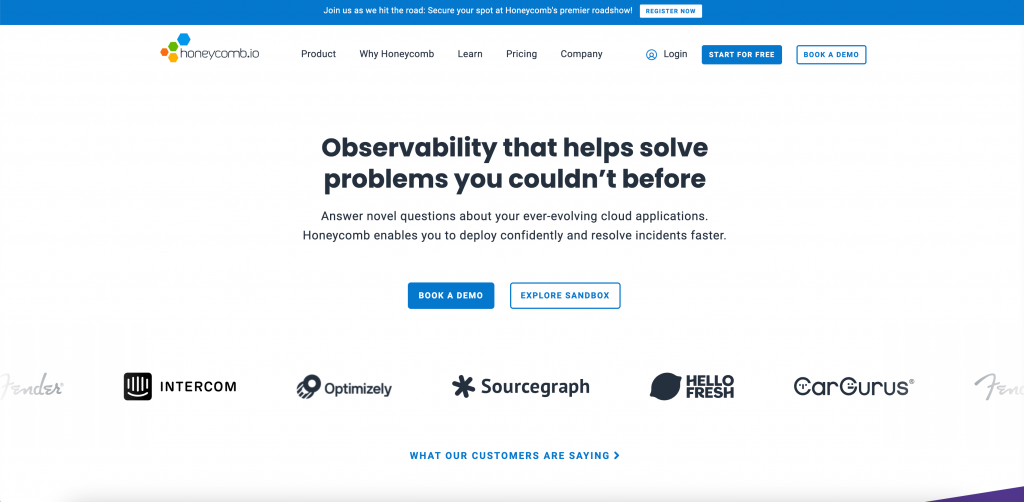
Honeycomb is a distributed observability platform that offers real-time monitoring and debugging for modern software applications. Its high-cardinality data exploration and dynamic sampling capabilities enable organizations to gain deep insights into the performance and behavior of their systems and applications.
Key features
- Captures unlimited custom attributes for dubbing with no impact on speed, allowing for faster and more accurate observability
- Distributed tracing to help you consolidate logs and metrics into a single workflow
- OpenTelemetry features to provide Otel SDKs for popular languages and start sending data directly to Honeycomb
- AI-powered assistant to help you ask questions and generate answers to your queries
Pricing
- Free plan.
- Pro: Starts $130 per month.
- Enterprise: Custom pricing.
Pros:
- High-cardinality data exploration capabilities enable users to analyze large volumes of data and uncover hidden insights.
- Real-time collaboration features facilitate efficient communication and problem-solving among team members.
- Distributed tracing provides end-to-end visibility into complex distributed systems, enabling users to identify and resolve performance issues quickly.
Cons:
- Advanced features such as high-cardinality data exploration and dynamic sampling may require additional configuration and setup, potentially increasing implementation time and complexity.
- While the platform offers comprehensive monitoring capabilities, some organizations may find that additional customization or integration is necessary to meet their specific needs.
New Relic
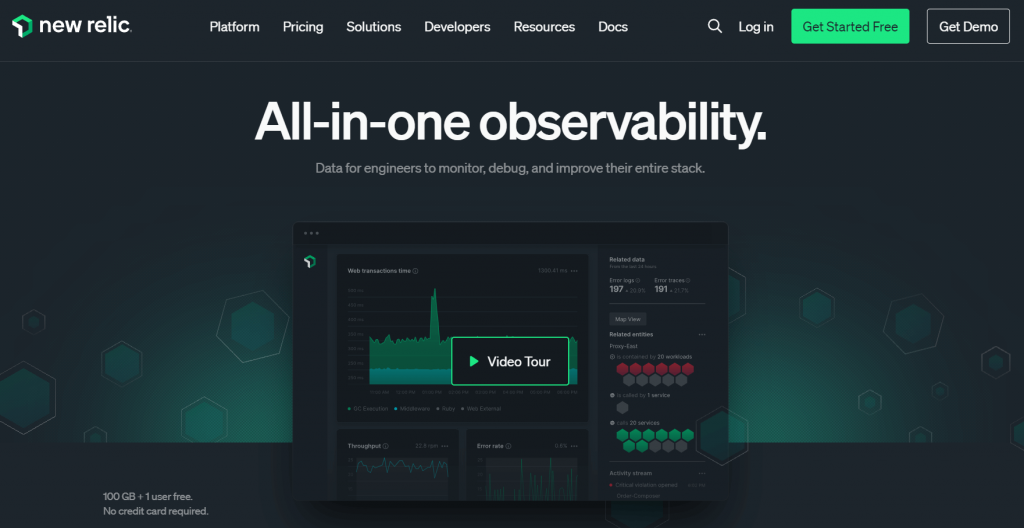
New Relic is a full-stack observability tool that shows metrics, events, logs, and traces in a single platform. With its full-stack monitoring capabilities and extensive integrations, New Relic enables organizations to gain deep insights into the performance and reliability of their systems and applications.
Key features
- Comprehensive monitoring capabilities for the entire technology stack, including applications, infrastructure, and user experience.
- Powerful application performance monitoring capabilities that provide real-time insights into application performance, enabling proactive problem-solving and optimization.
- Infrastructure monitoring features that provide visibility into the health and performance of cloud and on-premises infrastructure, helping organizations ensure the reliability and scalability of their systems.
- Log management capabilities that enable organizations to centralize and analyze log data from diverse sources, facilitating troubleshooting and issue resolution.
Pricing
Usage-based custom pricing model.
Pros
- At-a-glance app health insights.
- Shows real-time user insights.
Cons
- Overwhelming user interface.
- Complex setup and configuration may require additional time and resources to implement effectively, potentially increasing the time to value for new users.
- Lacks customer support.
IBM Instana
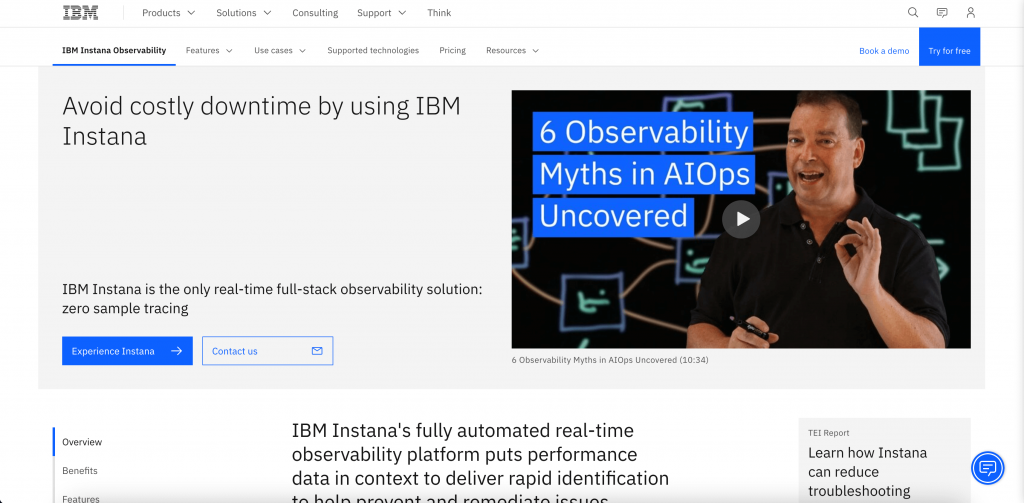
IBM Instana is a real-time full-stack observability solution that provides organizations with end-to-end infrastructure monitoring to help prevent and remediate any issues. The tool goes beyond traditional APM solutions by enabling observability across processes such as DevOps, SRE, platform engineering, ITOps, and development.
With its automatic discovery and monitoring of microservices, distributed tracing, and AI-driven root cause analysis, Instana empowers organizations to gain deep insights into the performance and behavior of their systems and applications.
Key features
- Full-stack observability helps organizations continuously monitor application performance, Kubernetes, databases, microservices, APIs, and containers in real-time with no sampling.
- Automation and intelligence to automatically discover and map services, ingest observability metrics, and trace requests and profiles.
- Integrations with 300+ tools to provide a comprehensive view of application performance across IT infrastructure.
Pricing
- Infrastructure quality monitoring: Starts at $20 per month per host.
- Performance monitoring for applications and infrastructure: Starts at $75 per month per host.
Pros
- Distributed tracing enables organizations to trace requests across distributed systems, identify performance bottlenecks, and optimize resource usage.
- AI-driven root cause analysis automates the detection and resolution of performance issues, reducing manual effort and enabling proactive problem-solving.
Cons
- Complex setup and configuration may require additional time and resources to implement effectively, potentially increasing the time to value for new users.
Zipkin
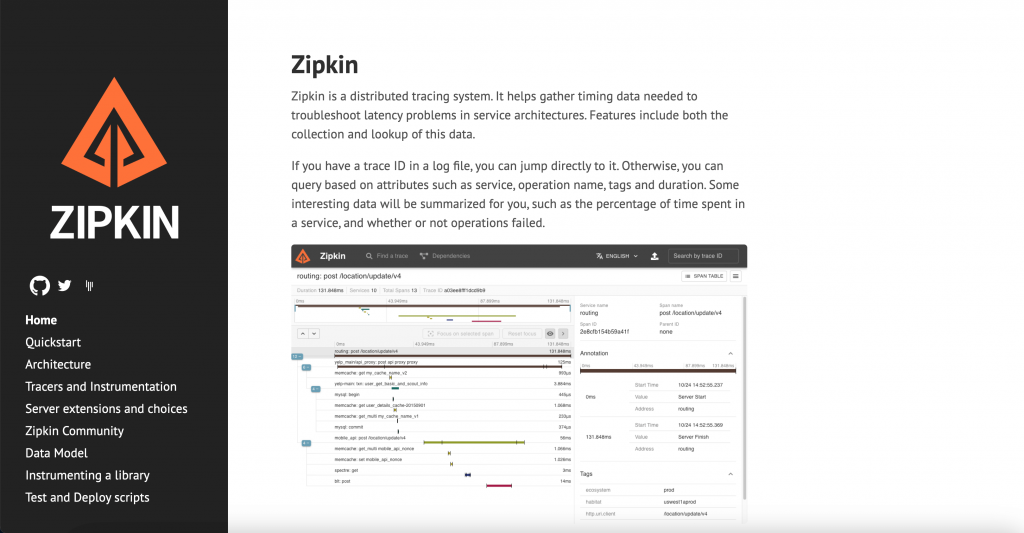
For companies that are just discovering the need for an observability solution, Zipkin can be a great option. This open-source distributed tracking system provides insights into latency problems in microservices architectures.
With its distributed tracing capabilities, dependency visualization, and extensive language and framework support, Zipkin enables organizations to gain deep insights into the behavior and performance of their systems and applications.
Key features
- Offers distributed tracing capabilities that enable organizations to trace requests across distributed systems, identify performance bottlenecks, and troubleshoot latency issues.
- Supports a wide range of programming languages and frameworks.
- Provides dependency visualization features that allow users to visualize the relationships between different components in their microservices architectures, enabling them to understand the flow of requests and responses.
Pricing
- Open-source.
Pros
- Extensive language and framework support ensures compatibility with diverse technology stacks and environments, enabling organizations to leverage Zipkin in a wide range of use cases.
- Open-source and customizable nature of Zipkin allows users to tailor the platform to their specific needs and preferences, contributing to its ongoing development and improvement.
Cons
- While Zipkin offers powerful tracing capabilities, some users may find that additional features such as log management and metrics monitoring are not available out-of-the-box, requiring integration with additional tools or platforms.
- As an open-source project, Zipkin may lack some of the advanced capabilities and support options available with commercial observability platforms, potentially limiting its suitability for enterprise-scale deployments.
- While Zipkin is highly customizable, organizations with specific compliance or security requirements may need to invest additional effort in ensuring that their deployments meet regulatory standards.
SigNoz
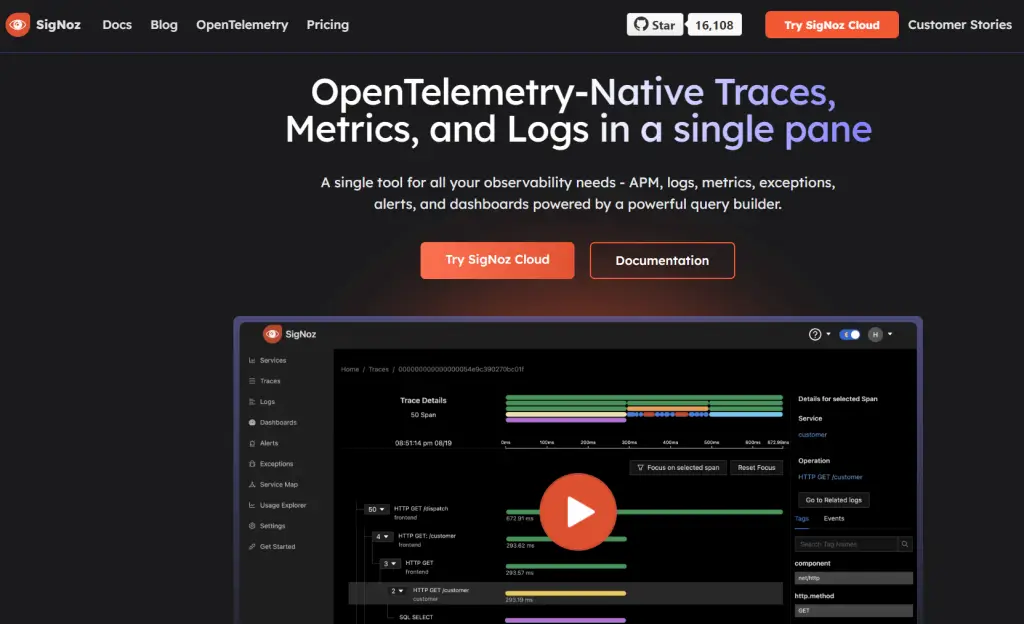
SigNoz is an observability tool that uses OpenTelemetry-Native traces, metrics, and logs to help users monitor applications and troubleshoot issues. The tools consolidates data from multiple source to help you debug issues faster.
Key features
- Offers a unified platform for monitoring metrics, logs, and traces.
- Consolidates data from diverse sources into a single interface for seamless analysis and diagnostics.
- Real-time data application performance monitoring with database and external call tracking.
- Intelligent alerting capabilities allow users to set up customizable alerts for key performance indicators and threshold breaches, ensuring proactive monitoring and timely issue resolution.
Pricing
Hosted on SigNoz cloud:
- Teams: Starts $199 per month.
- Enterprise Cloud: custom pricing.
Hosted in your infra:
- Community Edition: free to self-host.
- Enterprise Edition: custom pricing for scale (starts at $2500 per month).
Pros
- Streamlined installation and setup process.
- AI-driven anomaly detection for proactive issue mitigation.
- Extensive customization options for dashboards and alerts tailored to specific use cases.
Cons
- Learning curve associated with mastering advanced features and configuration settings.
- Potential affordability challenges for small to medium-sized organizations with limited budgets.
How to choose the right observability tool?
Now that we have explored the top observability tools, you should have a fair idea about what each tool brings to the table. The key factors that you should look into when evaluating these data observability tools include:
Specific Requirements
Identify the specific need for observability, and make sure that the tool you opt for has the features and capabilities that align with your needs, such as metrics monitoring, log management, distributed tracing, synthetic monitoring, or more.
Scalability
Assess whether the tool can scale to meet the demands of your organization’s infrastructure and applications. Look for features such as auto-discovery and dynamic scaling that can adapt to changes in workload and traffic volume.
Integration
Ensure your chosen tool integrates easily with your organizational architecture and existing workflows.
AI & Automation
Look for observability tools that leverage artificial intelligence and automation to streamline monitoring processes and proactively identify issues. Features such as AI-driven anomaly detection and automated root cause analysis can help reduce manual effort and improve efficiency.
Pricing
Make sure that the observability tool you need fits into your budget. Consider factors like subscription fees, data ingestion costs, and additional charges for advanced features to get a realistic view of your costs.
Testing
In addition to these factors, do not forget to make the most of free trials. Test the tool out before you decide that it is the best fit for your organization’s unique requirements.
Which observability tool should you choose in 2024?
Each tool covered in this top Observability tools in 2024 list offers it’s unique features and capabilities.
Observability tools should go beyond simple monitoring, offering a comprehensive view of your entire digital landscape. In this regard, it is evident that Middleware.io stands out as a comprehensive observability platform.
With its simplified installation, customizable dashboards, and comprehensive support offering, Middleware empowers organizations to gain real-time visibility and insights into their complex systems and applications.
Its distinctive pricing model ensures that you can adopt an agile approach and pay as you go, making it ideal for your unique business requirements.
Get started with Middleware for free, or contact us for a personalized demo.