


What is a Flame Graph?
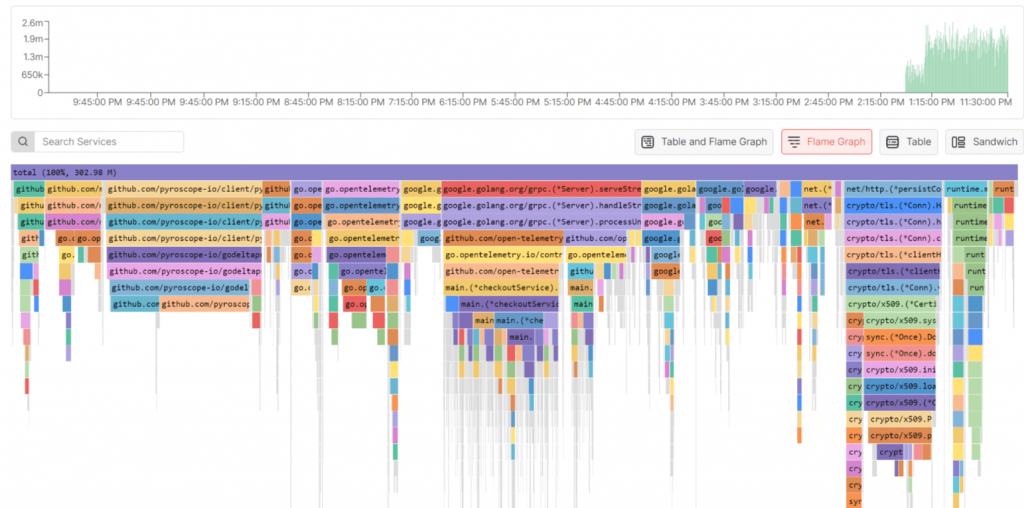
A Flame Graph is a visual representation of software stack traces, portraying the execution flow of a program. It offers a holistic view of system performance, condensing intricate stack trace data into a comprehensible format.
- Rectangular Frames: Each frame represents a function in the software stack.
- Vertical Stacking: Frames are stacked vertically, showcasing the call hierarchy.
- Width Indicates CPU Usage: The width of each frame corresponds to the function’s CPU usage, aiding in the quick identification of resource-intensive components.
Flame chart vs flame graph: What’s the difference?
Flame charts and flame graphs share similarities but differ in their visual representations and purposes:
- Orientation: Flame charts typically display data horizontally, offering a chronological view of stack traces over time. On the other hand, flame graphs represent information vertically, providing a compact and intuitive visualization of the entire stack at a glance.
- Chronological vs. Hierarchical: Flame charts excel in presenting the chronological order of events, making them suitable for tracking changes over time. Flame graphs, with their vertical stacking, emphasize the hierarchical structure of function calls, facilitating a quick assessment of resource utilization.
- Compactness: Flame graphs are known for their space efficiency, presenting a condensed yet comprehensive overview of the entire call stack in a single view. This compactness aids in quickly identifying performance bottlenecks.
Understanding these differences allows users to choose between flame charts and flame graphs based on their specific needs for performance analysis.
Why are Flame Graphs important?
Flame graphs, visual representations of software stack traces, serve as pivotal tools in performance analysis, offering a unique perspective on program execution.
Holistic View of Execution Flow: Flame graphs provide developers with a bird’s-eye view of a program’s execution, showcasing the entire stack trace in a single, comprehensible visual. This holistic perspective is invaluable for understanding how different functions contribute to overall performance.
Efficient Bottleneck Identification: The width of each frame in a flame graph directly correlates with CPU usage, allowing developers to quickly identify resource-intensive components. This efficiency in pinpointing bottlenecks accelerates the troubleshooting process and streamlines optimization efforts.
Quick Troubleshooting: The graphical nature of flame graphs enables rapid troubleshooting and root cause analysis. Developers can visually trace the execution path, making it easier to identify problematic areas and optimize code for better performance.
Space-Efficient Overview: Flame graphs present a compact yet comprehensive representation of the entire call stack. This space efficiency enhances usability, especially when dealing with large and intricate codebases, making it easier for developers to navigate and understand the program’s structure.
Transcending Profiling Limitations: Flame graphs go beyond the capabilities of traditional profiling tools by offering a dynamic and condensed visualization of stack traces. This transcendence empowers developers with a more intuitive tool for strategic optimization efforts, ultimately resulting in high-performing software applications.
Get a holistic view of your application’s performance with Flame Graphs. Get Started Free.
How to Interpret a Flame Graph?
Interpreting a flame graph involves understanding its key elements to gain insights into a program’s performance.
The fundamental concept behind a flame graph is to visually represent a program’s function call stack as a “flame”-shaped image. Each rectangle in the graph corresponds to a function, with its width representing the proportion of resources occupied by that function and its height indicating the call depth (number of layers of recursive calls).
Analyzing flame graphs at different time points helps swiftly identify performance bottlenecks, enabling targeted optimization. A wide rectangle at the top of the stack typically signals a bottleneck that requires analysis and optimization.
- Width of Rectangles: Indicates the proportion of resources (CPU time) consumed by each function.
- Height of Rectangles: Represents the call depth, showing the number of recursive call layers.
- Position on the Graph: Top-wide rectangles may signal potential bottlenecks for analysis.
- Color Coding: Enhances readability by distinguishing different functions or categories.
Interpreting in Middleware: Flame Graph View
- Hierarchical visualization where each level represents a function or method.
- The width of graph segments corresponds to resource consumption.
- Enables quick identification of performance hotspots and understanding of program execution flow.
Flame Graph Types:
- Flame Graph (Narrow Sense):
- Root is at the bottom, and child nodes are displayed above their parent nodes.
- Useful for visualizing the call hierarchy and understanding function relationships.
- Icicle Graph:
- Root is at the top, and child nodes are displayed below their parent nodes.
- Provides an alternative visualization perspective while retaining the same underlying data.
Flame Graph Examples
Let’s explore different types of flame graphs and their unique characteristics:
CPU
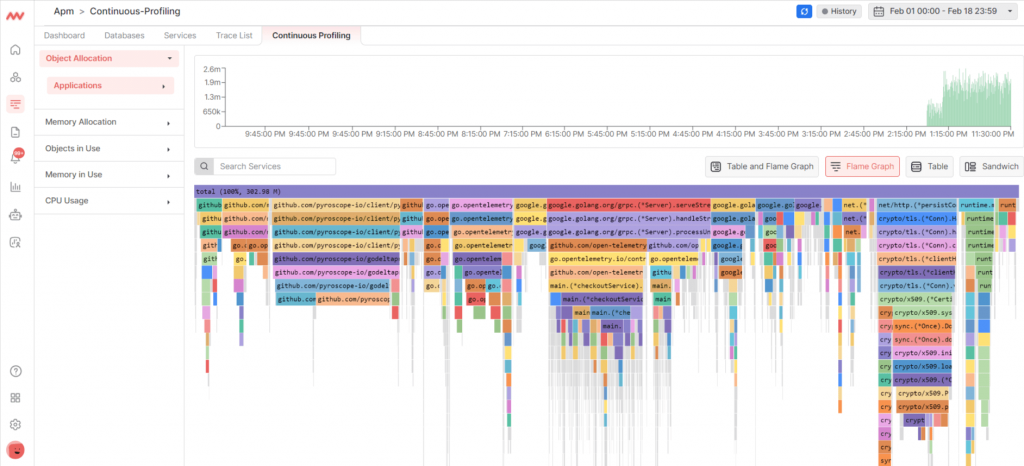
A CPU flame graph is a visual representation of CPU usage, illustrating how time is distributed across various functions or code paths during program execution.
From the left sidebar, you can select CPU usage options, which allow you to filter data based on a table or graph view. This interactive feature allows for a more detailed examination of CPU performance metrics.
- Developers and system administrators use CPU flame graphs to identify bottlenecks, hotspots, or inefficient code in their applications.
- You can compare different instances of CPU flame graphs to establish baselines, track changes, and assess the impact of optimizations over time.
Memory
A Memory Flame Graph visually represents memory consumption, showcasing the allocation distribution across different functions or code paths during program execution.
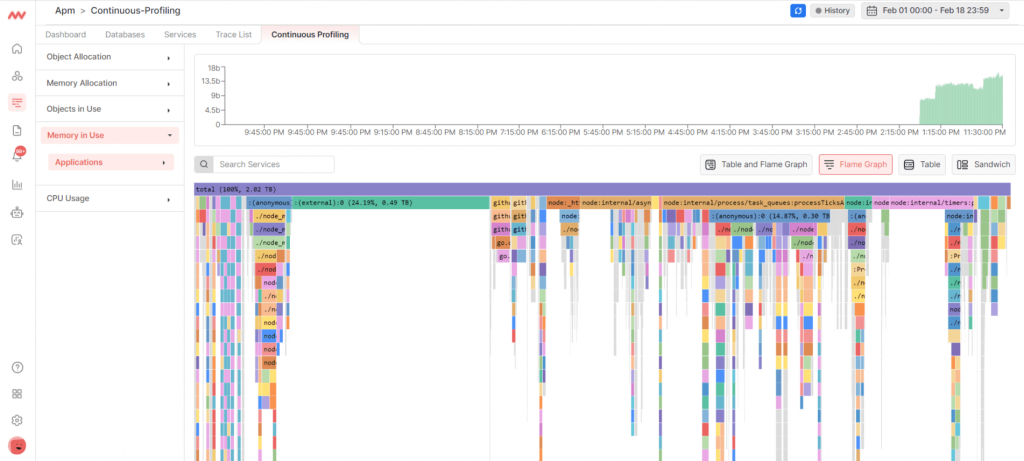
- Optimizing memory usage can reduce resource overhead. Unnecessary memory consumption can lead to increased costs, especially in cloud environments where resources are billed based on usage.
- Developers and system administrators utilize Memory Flame Graphs to identify memory-related issues, such as leaks or inefficient usage, facilitating the optimization of memory allocation within applications.
Off-CPU
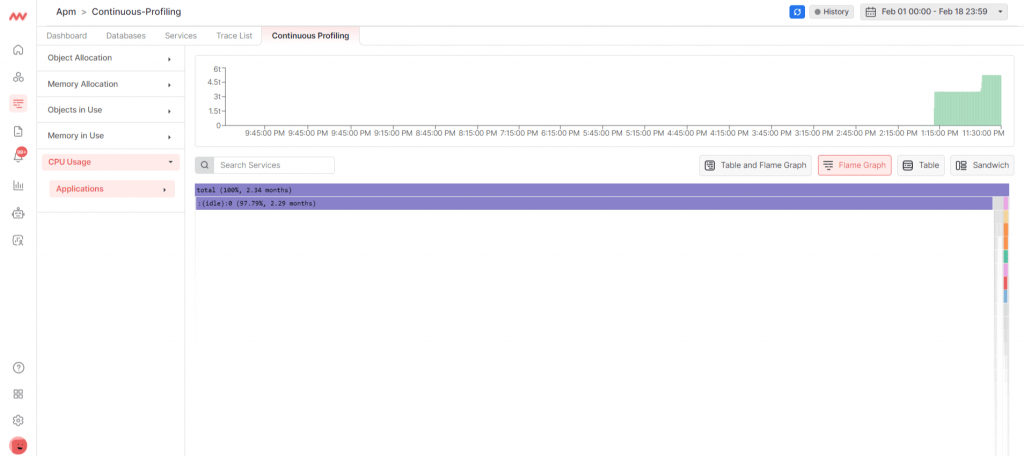
An Off-CPU Flame Graph provides a visual representation of CPU idle time or waiting periods, highlighting moments when the CPU is inactive during program execution.
It is a valuable tool for developers and system administrators to identify and understand the reasons behind CPU stalls or waits, contributing to a comprehensive analysis of system performance.
- You can compare different instances of Off-CPU Flame Graphs to establish baselines, track changes, and assess the impact of optimizations on CPU idle time over time. This aids in understanding the effectiveness of performance improvements.
- Understanding and addressing off-CPU issues contribute to effective capacity planning, preventing resource contention and optimizing resource utilization.
Hot/Cold
A Hot/Cold Flame Graph represents the frequency or intensity of execution for different functions or code paths during program runtime. “Hot” paths are frequently executed, while “Cold” paths are less commonly traversed.
Developers use Hot/Cold Flame Graphs to identify critical code paths (hotspots) that contribute significantly to overall execution time, aiding in optimization efforts.
Differential
A Differential Flame Graph compares two sets of profiling data, providing a visual representation of the differences between them. It is a powerful tool for understanding changes in code performance over time or after specific modifications.
Differential Flame Graphs support a culture of continuous improvement by providing insights into the effectiveness of changes and guiding further optimizations.
Developers use Differential Flame Graphs to assess how code changes, optimizations, or updates impact CPU usage, memory consumption, or other performance metrics.
Profiling Flame Graphs vs. Tracing Flame Graphs
Profiling Flame Graphs and Tracing Flame Graphs are two distinct techniques used in performance analysis, each offering unique insights into the behavior and efficiency of software applications.
Profiling Flame Graphs
Profiling Flame Graphs are typically generated using a sampling approach. The profiler periodically samples the program’s state to gather information on which functions are active at that moment.
- Profiling provides a more high-level and coarse-grained view of program execution. It identifies the functions that consume the most CPU time over the sampling period.
- Profiling Flame Graphs are especially useful for identifying hotspots in the code—areas where the program spends a significant amount of time.
- Profiling typically incurs lower overhead compared to tracing, making it suitable for capturing performance data with minimal impact on the running application.
Tracing Flame Graphs
Tracing Flame Graphs are generated by capturing detailed events during the program’s execution. Tracers record specific events, such as function calls, system calls, or memory allocations.
- Tracing provides a more fine-grained view of program execution, capturing detailed information about function calls, system calls, and other events.
- Tracing Flame Graphs is powerful for gaining detailed insights into the sequence of events and interactions within the program. They are valuable for diagnosing complex issues and understanding the complete program flow.
- Tracing typically involves more overhead compared to profiling, as it captures a more detailed set of events. This increased overhead might be a concern in performance-sensitive applications.
Considerations
Data Volume
- Profiling: Generates concise profiles based on sampled data, providing a quick overview.
- Tracing: Captures a larger volume of detailed data, offering a comprehensive understanding of the program’s behavior.
Ease of Use
- Profiling: Generally easier to set up and use, with lower impact on the application.
- Tracing: Requires more configuration and may impact performance more significantly but offers a more detailed and comprehensive view.
Use Case
- Profiling: Well-suited for identifying performance bottlenecks and hotspots.
- Tracing: Ideal for in-depth analysis, debugging, and understanding complex interactions within the application.
The choice between Profiling Flame Graphs and Tracing Flame Graphs depends on the specific goals of performance analysis, the level of detail required, and the acceptable level of impact on the running application. Often, a combination of both techniques may provide a well-rounded understanding of application performance.
Final Thoughts
Flame graphs illuminate the path to optimized software performance, revealing critical insights into CPU usage, memory consumption, and code behavior.
As developers integrate these visualizations into their toolset, the strategic use of flame graphs becomes a cornerstone in the continuous quest for efficient and responsive applications.
The next steps involve a practical application, ongoing learning, and the integration of flame graphs within a holistic performance analysis strategy.
Get started with Middleware for free and start visualizing your tech stack’s performance with flame graph view.