With the increasing reliance on cloud technology, it’s essential to monitor the performance of your cloud infrastructure to ensure it is always running at peak performance. However, with the ever-growing number of cloud monitoring tools and services available, it can be hard to decide which one to choose.
With the right monitoring tool, you can ensure that your cloud environment runs optimally and quickly identify potential issues before they become problems.
With that in mind, let’s dive into the top 15 top cloud monitoring tools & services for 2026 and explore their features.
What Is Cloud Monitoring?
Cloud monitoring is the process of gaining visibility into your cloud-based infrastructure, services, apps, and user experience. It allows you to monitor the environment, assess and forecast the overall infrastructure’s performance and availability, or dive into each component individually.
Cloud monitoring is essential to modern IT infrastructure management that helps DevOps teams ensure cloud performance, reliability, and availability through real-time visibility and automation.
Cloud monitoring tools gather data from various touch points in your cloud infrastructure, analyze it, and provide insights into key performance indicators such as memory consumption, CPU usage, network traffic, application performance, and much more.
Top 20 Cloud Monitoring Tools Engineers Must Try
The cloud monitoring industry is massive, to say the least. Given the increasing demand for more sophisticated solutions and new entrants making their way each year, one can only expect it to expand further.
So, to help you narrow down and select the best, we’ve compiled a list of the top 20 cloud monitoring tools and services, including paid and open-source options.
1. Middleware
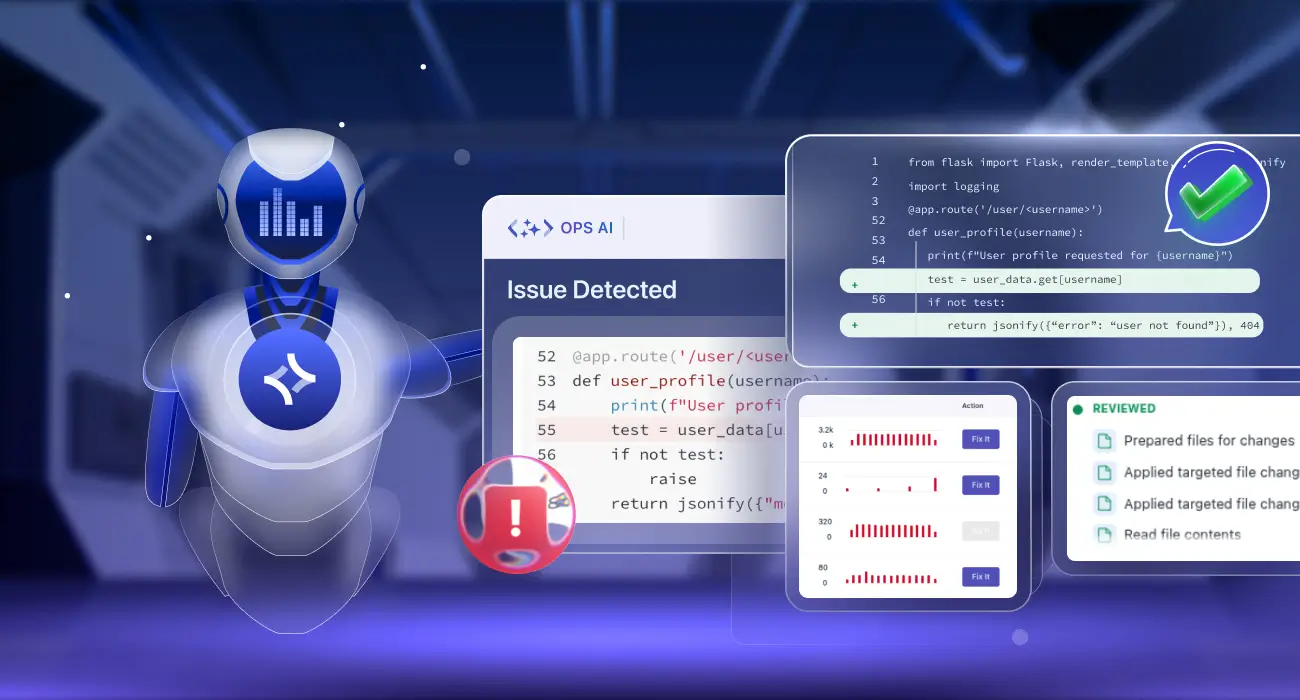
Designed with the ethos that simplicity is the ultimate sophistication, Middleware is a full-stack cloud monitoring platform that allows developers to monitor their cloud infrastructure with the power of AI. Regardless of size, complexity, or storage, you can monitor any software application or service in real-time.
Middleware is essentially a lightweight agent that promises to be more efficient than any other tool on this list while using fewer resources. It can also help DevOps teams reduce their observability costs by 5x.
Compliance and security are other areas in which Middleware is heavily invested. It is GDPR and CCPA compliant and boasts a SOC 2 type || certification.
Features
- Offers a range of observability capabilities to monitor your infrastructure, logs, application performance, LLMs, databases, containers, servers, and much more.
- It has 200+ integrations.
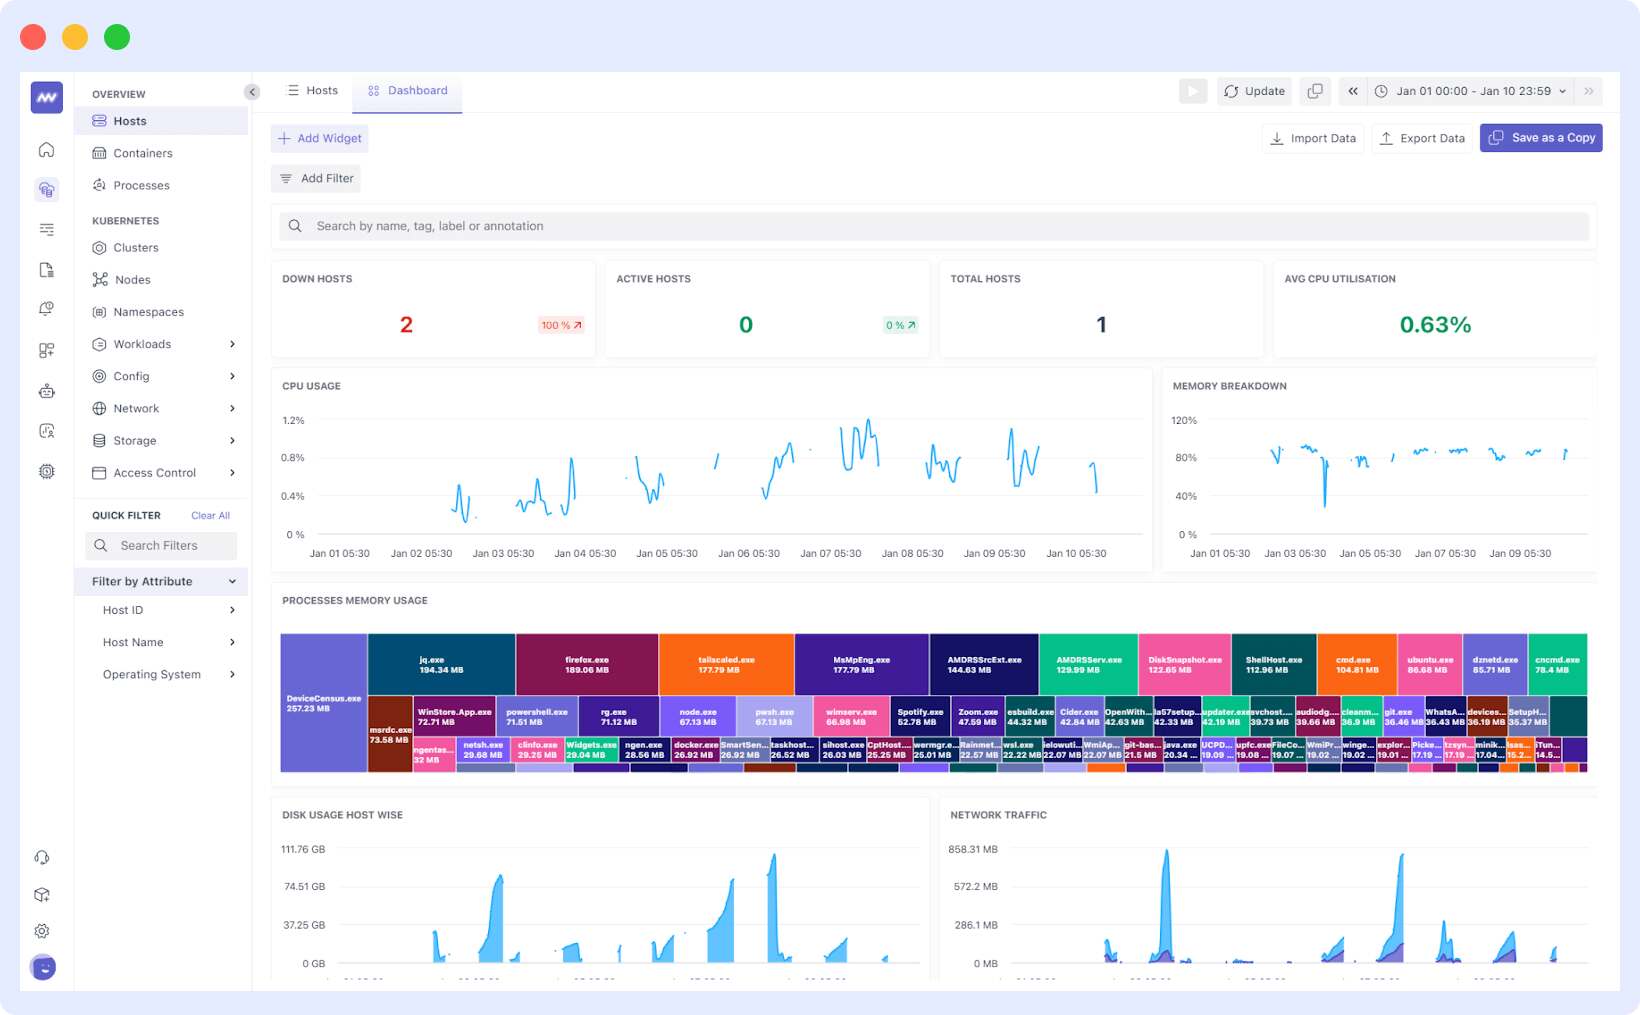
- There’s a single unified dashboard to track and monitor all your key parameters (metrics, logs, and traces) in one place.
- The support teams reduce troubleshooting time and MTTR.
- Teams can gain complete clarity about the source of errors and fix them.
- The end users can collect traces from the first moment of interaction.
- Real-time anomaly detection.
- You can improve data analysis with instant search and retrieval using plain English.
- Allows you to control data ingestion with feature flags & filters.
Pros
- The focus is on reducing the time it takes for developers to get insight into their applications and infrastructure.
- Middleware offers scalability, reliability, flexibility, and speed required by communities.
- You can easily focus on your application performance, security, and availability.
- The monitoring system offers real-time data collection, aggregation, storage, and analysis across all your infrastructure components – including servers, databases, and applications.
- You obtain a unified view of all the metrics our agents collected, allowing you to correlate various aspects of your application performance at any given time.
Cons
- Fairly new to the market.
Pricing
Middleware offers 3 pricing tiers: Free Trial, Pay-as-you-go, and enterprise.
Middleware offers a 14-day free trial with unlimited data ingestion. After
the trial, users can opt for the pay-as-you-go plan at $0.30/GB for
metrics, logs, and traces. Middleware also offers custom pricing for enterprises that require tailored solutions. You can check pricing.
2. Amazon Cloudwatch
Developers, system operators, site reliability engineers, and IT administrators can use Amazon CloudWatch to monitor and manage their systems. It provides valuable and timely insights to monitor applications, understand and respond to system-wide performance changes, optimize resource utilization, and create a unified view of operational wellness.
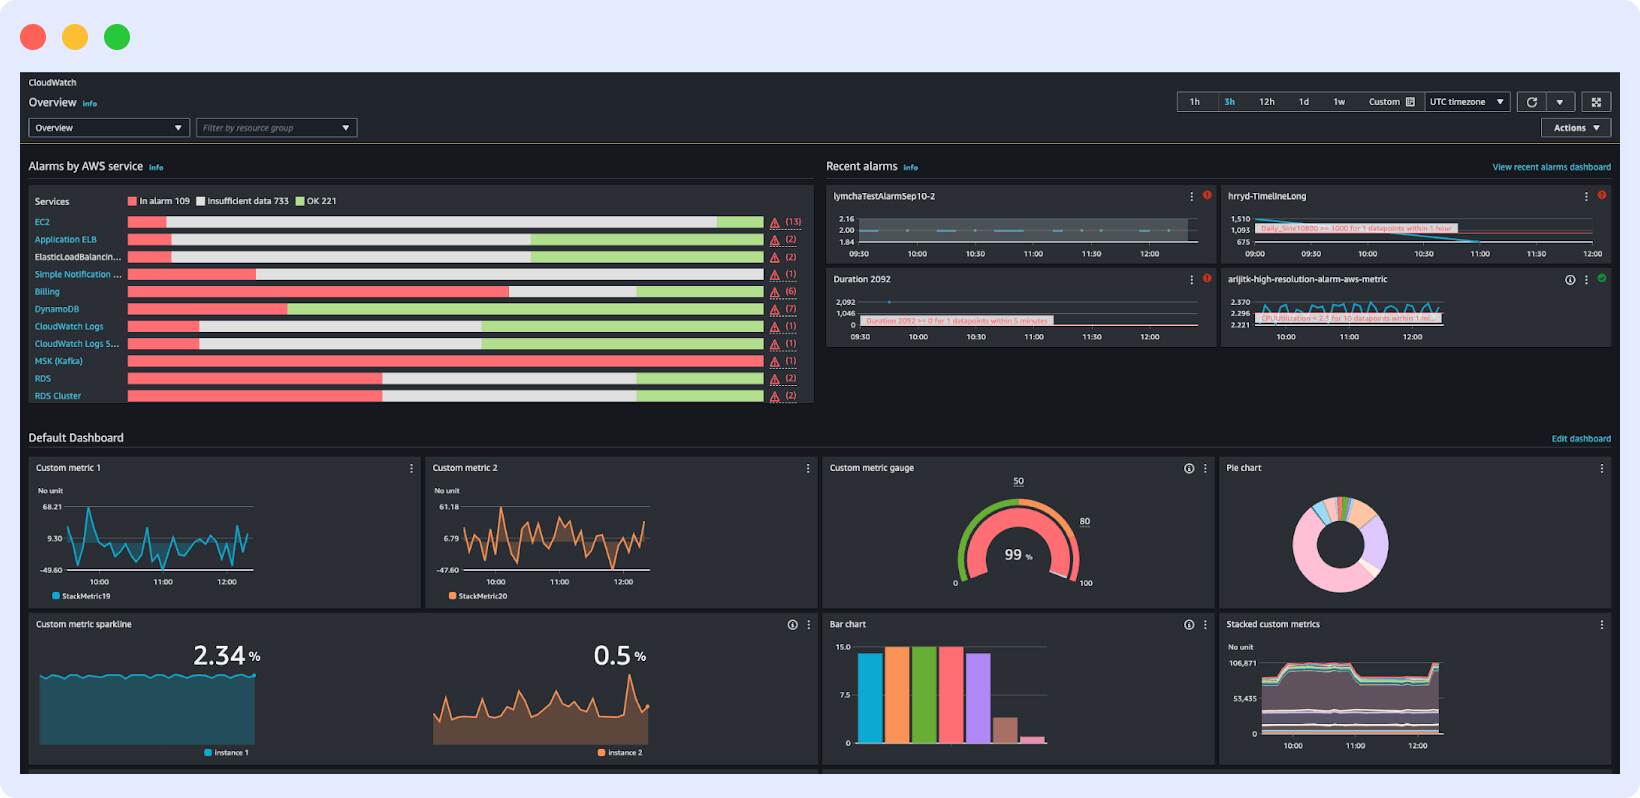
CloudWatch can gather and analyze both metrics and log data and can be integrated with over 70 AWS services. You can also use the service to trigger automated actions and processes when combined with CloudWatch Events.
Features:
- All information will be available on a single platform.
- The most comprehensive and in-depth knowledge about AWS Resources.
- Cross-application, infrastructure, and service visibility.
- Diminished Time to Resolution and Progress Average TCO stands for Total Cost of Ownership.
- Pay just for the services you utilize.
Pros:
- It may be used to set high-resolution alerts and view logs and data from a different perspective.
- Troubleshoot difficulties and automate operations to improve apps.
- Logs, metrics, and events are used to assemble data.
- Compatible with other AWS products.
Cons:
- The ability to customize dashboards should be improved.
- The user interface is extensive.
- Manually constructed alerts and alarms.
- Transferring alarms and alert information are not present.
Pricing:
Volume-based pricing means you only pay for the information you want to see and how thorough it is. The free tier allows for 5-minute metric granularity monitoring of your AWS services. EBS volumes, RDS DB instances, and Elastic Load Balancers are all eligible for the free tier. It includes up to ten metrics and then monthly alarms.
The free tier also provides up to 5GB of logs per month, three dashboards, and 100 synthetic monitor runs per month. The cost of the paid tier is determined by consumption.
For example, one-minute granularity measurements start at $0.30 per metric per month for the first 10,000 metrics and drop to $0.02 per metric per month once one million metrics are sent.
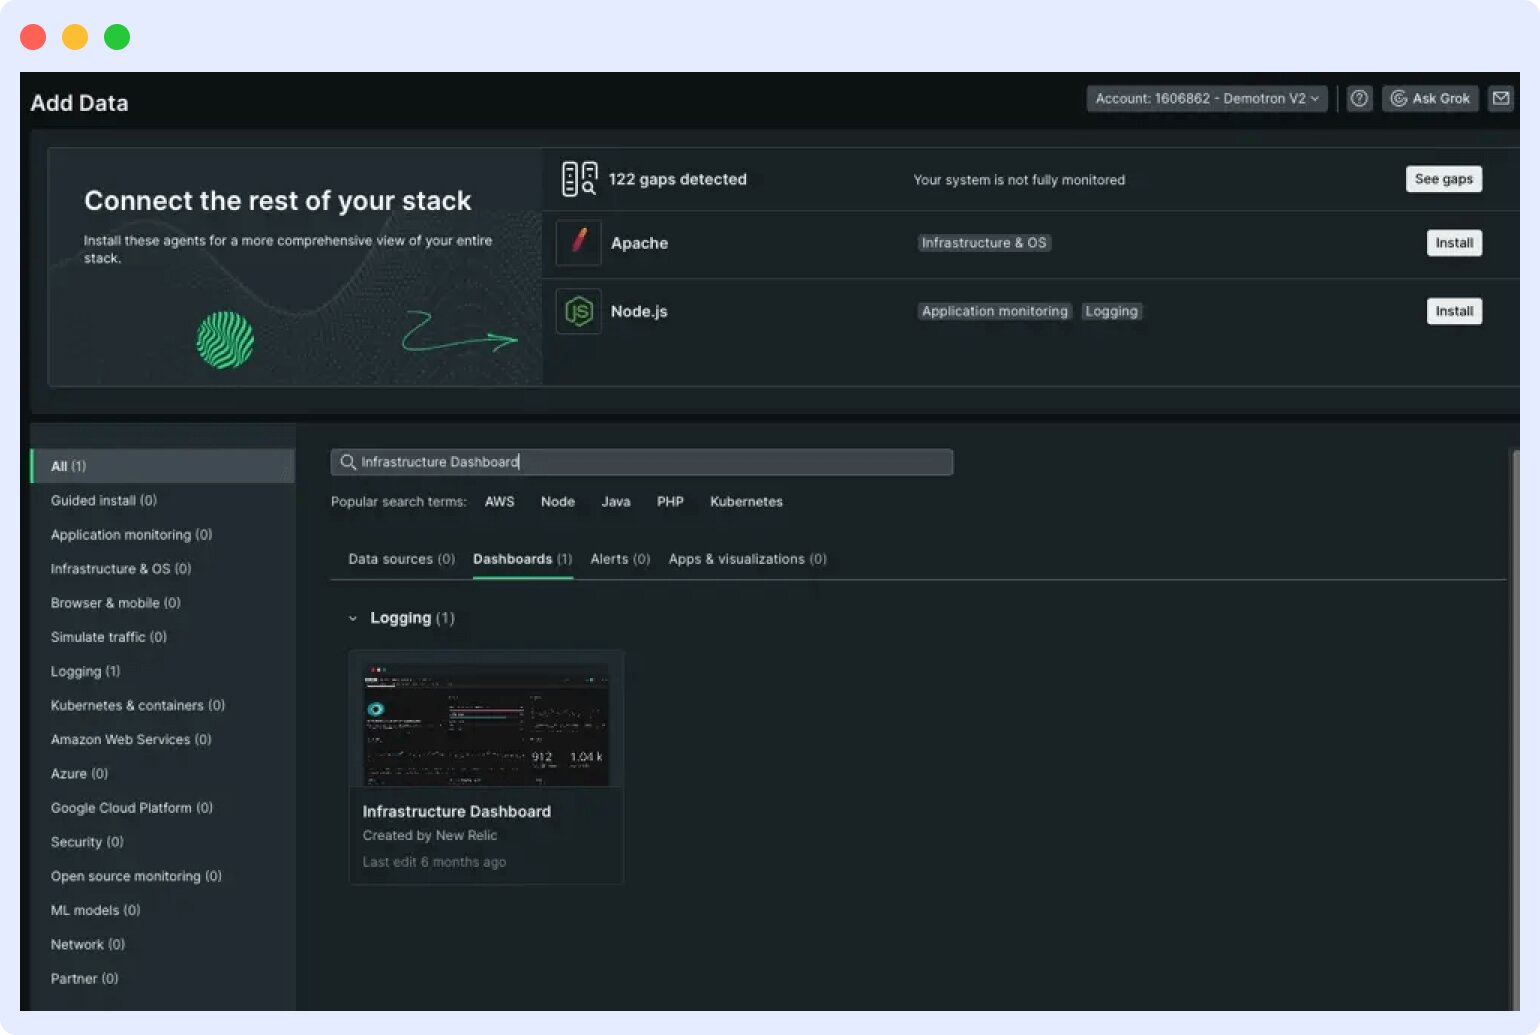
3. NewRelic
Among the most recent cloud monitoring tools, NewRelic is used widely. This tool is suited for cloud infrastructure monitoring, which is complicated and dynamic.
New Relic aids in the real-time knowledge of cloud apps and cloud servers. Page load, list of operating servers, error rates, and sluggish transactions can all be monitored from a single location. New Relic also assists with database performance monitoring by performing an SQL query.
Features:
- Error rates, website load times, sluggish transactions, and a list of running servers may all be viewed in one location.
- New Relic checks database performance by executing an SQL query.
- When an issue occurs, you may set your own alerts and cautions.
- Make your own dashboards.
Pros:
- It is adaptable and simple to install.
- The information granularity is superb.
- Create your own alert metrics by integrating with multiple tools.
Cons:
- In the beginning, metrics might seem perplexing.
- The mobile application could be improved.
- Expensive.
- Lacks support.
Pricing:
- The Free tier offers 100 GB of data ingest, one full platform user, and unlimited basic users, but with limited features.
- The Standard tier costs $49 per core user, with 100 GB of data ingest, limited features, and support.
- The Pro tier is priced at $349 per full platform user, with commitment options, priority support, and advanced features.
- The Enterprise tier offers custom pricing, advanced security, priority support, and tailored solutions.
Editor’s Choice: New Relic Pricing: Still Worth It in 2026?
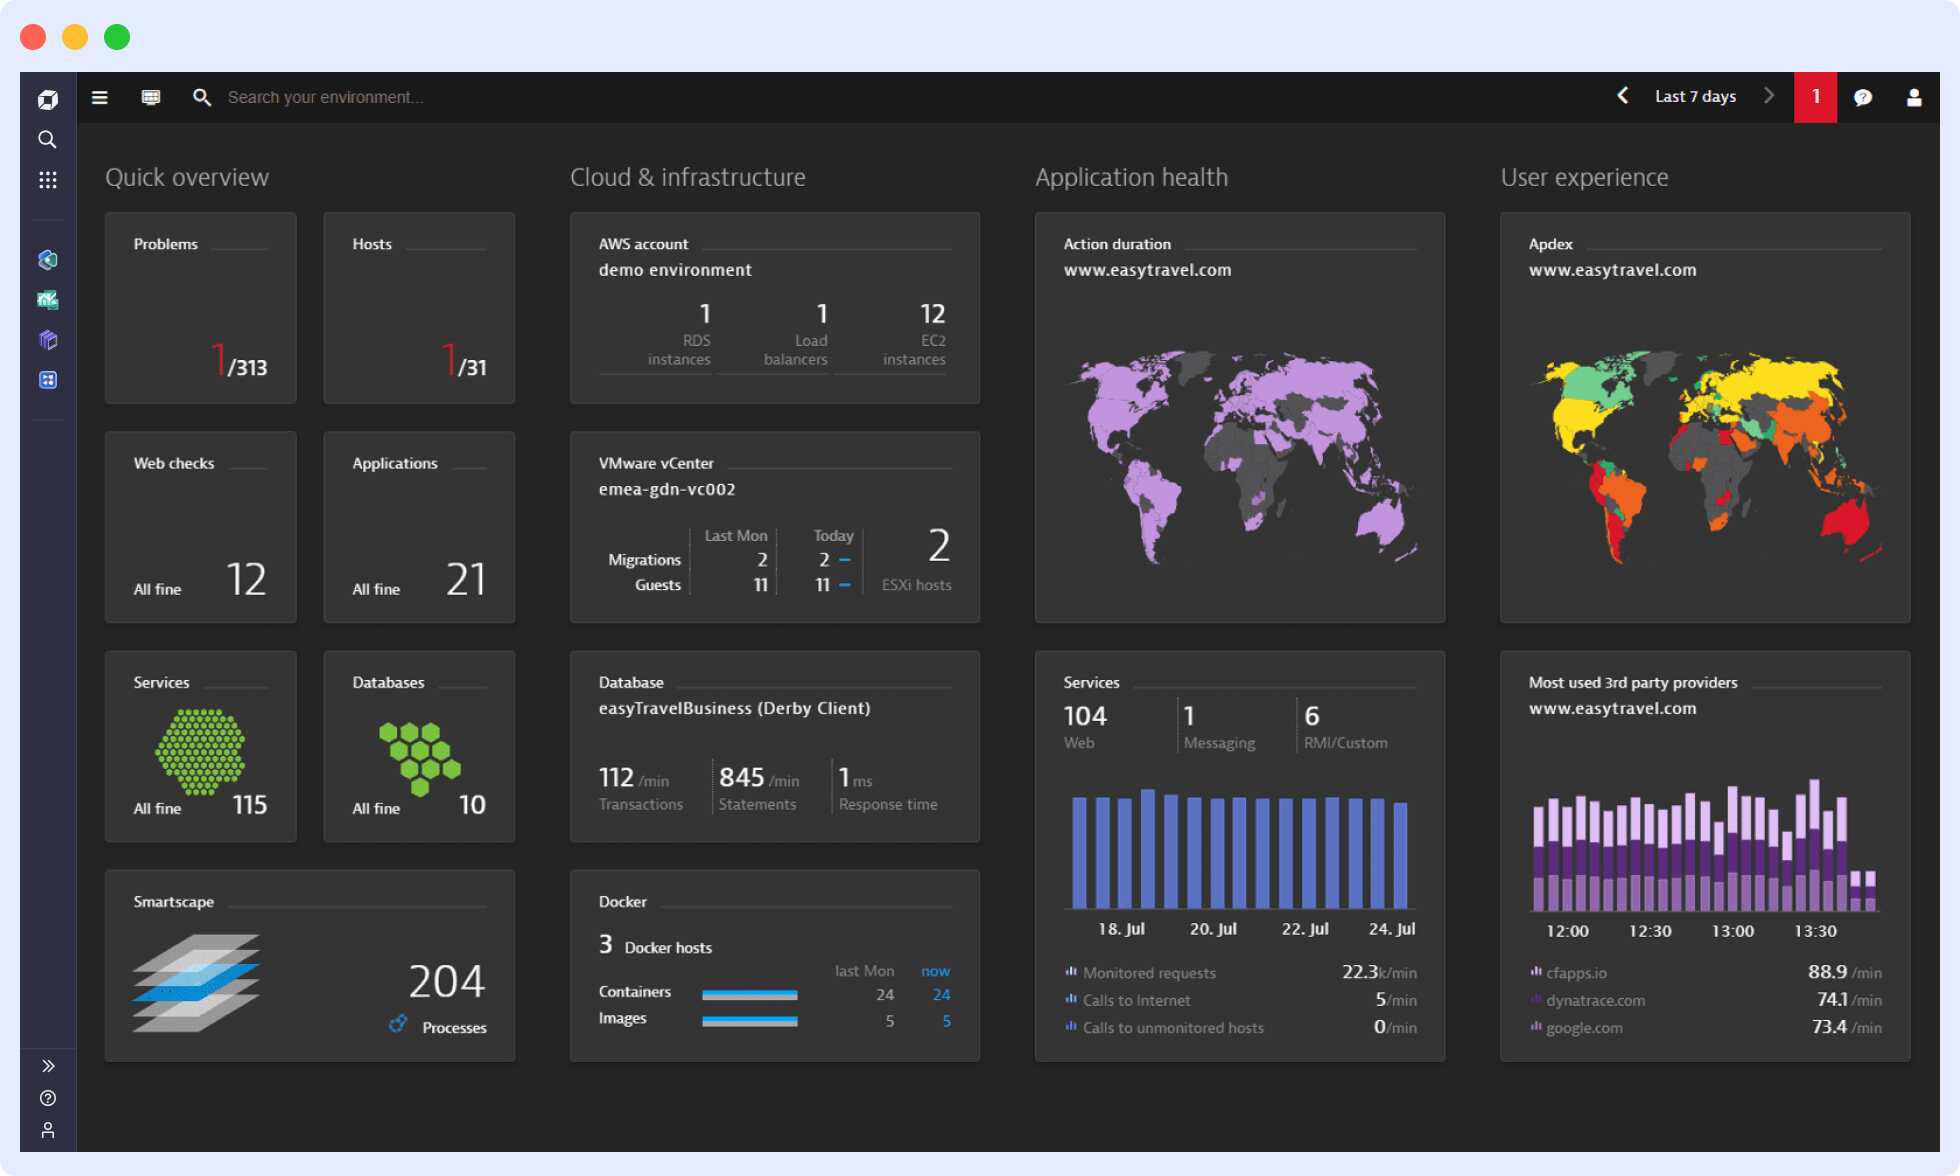
4. Dynatrace
Dynatrace is a full-stack observability solution with a user-friendly interface for monitoring cloud apps, infrastructure, and logs. The tool offers a single operating agent that can be managed via the Dynatrace UI once deployed, making monitoring simple and enjoyable to use.
Dynatrace will meet most of your monitoring needs when it comes to application performance monitoring, actual users, logs, and infrastructure. It is available in both software as a service and on-premise models.
Features:
- Dashboarding and comprehensive integrations for frequently used tools, as well as code-level tracing, are available for cloud application performance monitoring.
- Support for advanced log analysis, including automated detection of common system and application log types.
- Monitoring of real and simulated users.
- Memory dumps, exceptions, and CPU analysis, as well as top database and web queries, are all possible with diagnostic tools.
- Integrations with Docker, Kubernetes, and OpenShift.
- Support for Amazon Web Services, Microsoft Azure, and Google Cloud Platform.
Pros:
- Straightforward agent installation with UI help for novice users with demo data to gain a better understanding of the product.
- You can monitor the logs of your cloud services and apps using a sophisticated integration library – virtually anything can be done from the UI.
- An intuitive and powerful top-to-bottom view of the whole stack, from the mobile/web application through the middle layer and database.
- Dedicated problem-solving features to aid in problem-solving speed and efficiency.
Cons:
- Many options might be intimidating at first, but the solution makes every effort to assist new users.
- In comparison to AppDynamics and Datadog, for example, business metrics analysis is still restricted.
- When compared to other serverless alternatives on the market, such as Datadog, New Relic, and AppDynamics, the serverless offering is restricted.
- Only once you join up can you get pricing information.
Pricing:
The pricing is based on the features. Pricing for application performance monitoring is based on the number of hosts and the amount of RAM each host has. Each 16GB is a host unit, and the pricing is based on how many host units are used in an hour.
The price of real user monitoring (RUM) is determined by the number of sessions, whereas synthetic monitoring is determined by the number of activities. Finally, similar to the other solution providers discussed in this post, the logs component of the solution is computed depending on data ingestion.
Know why Middleware is an ideal Dynatrace alternative.
5. LogicMonitor
LogicMonitor is a quick and easy way to set up a server monitoring architecture. The platform’s automatic discovery capability, which employs several protocols to quickly locate and monitor devices and applications, is a crucial distinction.
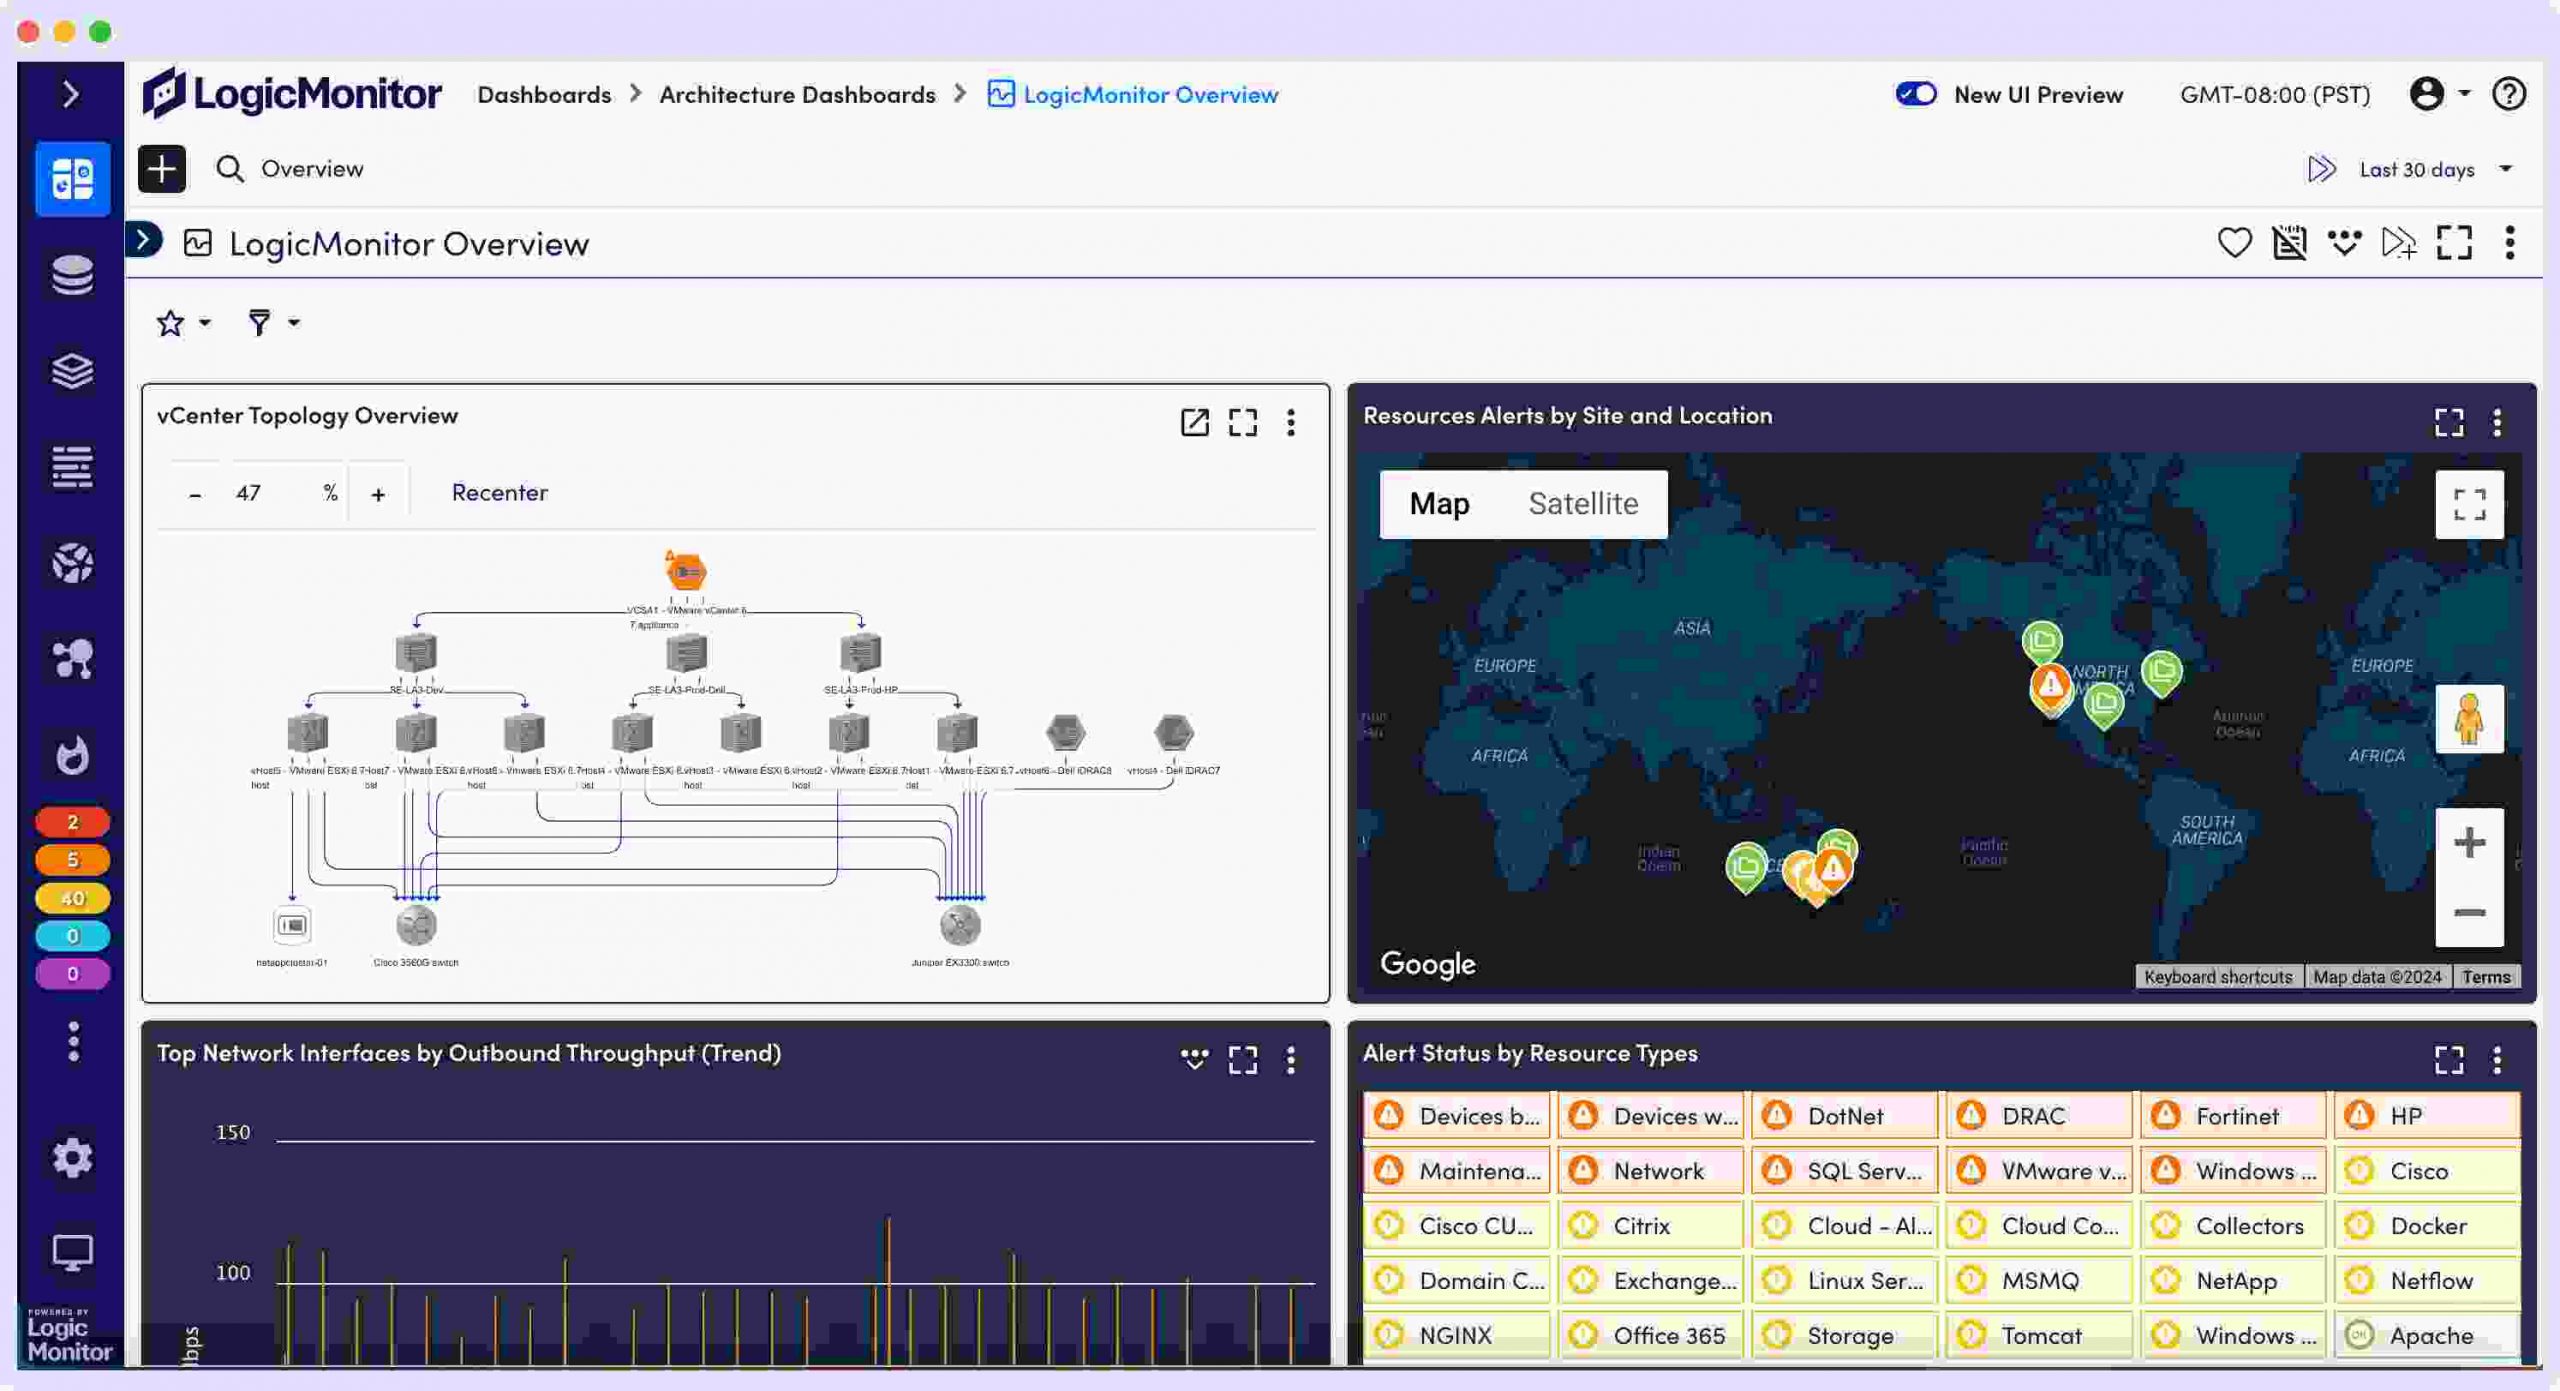
LogicMonitor can monitor servers on-premises as well as hypervisors and cloud installations.
Features:
- With its agentless and cloud-based collection, implementation takes only a few minutes.
- SNMP, jFlow, NetFlow, sFlow, WMI, NBAR2, and IPFIX are all used for monitoring.
- LogicMonitor provides a comprehensive picture of the network, making it simple to browse and diagnose problems.
- Intelligent alerts, network topology mapping, and root cause analysis
- This network management tool has powerful visualization and configurable dashboard tools that let you rapidly understand your system, how it’s linked, and what problems are affecting performance.
- Auto-discovery of any device on any network with over 2000 out-of-the-box connections with leading brands.
- Offers AI-based anomaly detection and dynamic thresholds for alerting.
Pros:
- Cloud-based application performance monitoring.
- Assets in hybrid cloud settings may be monitored.
- The dashboard may be personalized and preserved, which makes it ideal for multiple NOC teams or individual users.
Cons:
- Reporting needs improvement.
- Free trial: 14-days, the free version.
Pricing:
- LogicMonitor offers a 14-day free trial. Pricing varies depending on each company’s needs, so you’ll need to contact the vendor for a customized quote. The platform is available in two main editions:
- Pro Edition: Access to the platform’s cloud-based architecture, supporting up to 199 devices.
- Enterprise Edition: Includes additional AI-based features, such as root cause analysis, dynamic thresholds, forecasting, and more, supporting over 200 devices.
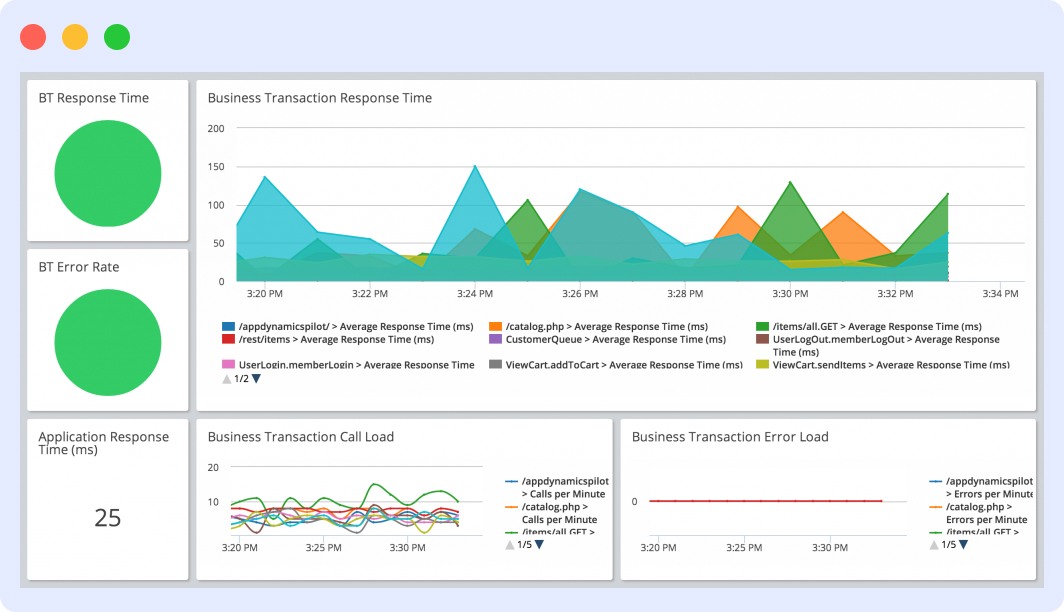
6. AppDynamics
AppDynamics offers cloud-based network monitoring solutions in both a software-as-a-service and an on-premise approach, allowing you to examine the performance of the whole stack that powers your services.
It caters to large businesses by allowing them to link application performance indicators with infrastructure data, alerts, and business-level KPIs. The platform provides you with information about your environment, ranging from top-level transactions that business leaders can understand to code-level data that DevOps and engineers can use.
Features:
- End-user monitoring using real-time, synthetic, and Internet of Things monitoring on smartphones and browsers.
- Cloud infrastructure monitoring provides insight into network components, databases, and servers, providing data on status, usage, and flow between each part.
- Business-oriented dashboards and features visualize and analyze the relationships between performance and business-related data.
- Anomaly identification and root cause investigation were helped by Machine Learning.
- Email templating and period digest features are available for alerting.
Pros:
- Very specific information on the environment, such as JVM application launch settings, JVM version, and so on.
- Provides sophisticated language features, such as automated leak detection and object instance tracking for the JVM-based stack.
- Connections between system components, environment aspects, endpoint response times, and business activities are all visible.
- Up to code-level visibility and automatic diagnostics are provided for server and application metrics.
Cons:
- Pricing is prohibitively costly, complicated, and opaque. Concentrated on conventional high-touch sales tactics and selling to major corporations.
- The agent must be manually downloaded and started during installation; there is no one-line installation and configuration function.
- Some fundamental data, such as system CPU, memory, and network consumption, are not available in the free plan.
- Compared to some of the other tools described in this description that enable comprehensive dashboarding features, such as Sematext, Datadog, or New Relic, slicing and dicing through the data is more difficult.
Pricing:
AppDynamics offers 2 pricing models: a 15-day free trial and the Enterprise Edition which is the most comprehensive plan, including APM, cloud infrastructure monitoring, and business performance monitoring tools. The Enterprise Edition is priced at $90.00 per month per CPU core.
7. Datadog
Datadog excels in reducing complicated data points in vast contexts. This is accomplished through its powerful filtering and elegant UI, which makes combining data from many cloud services even simpler.
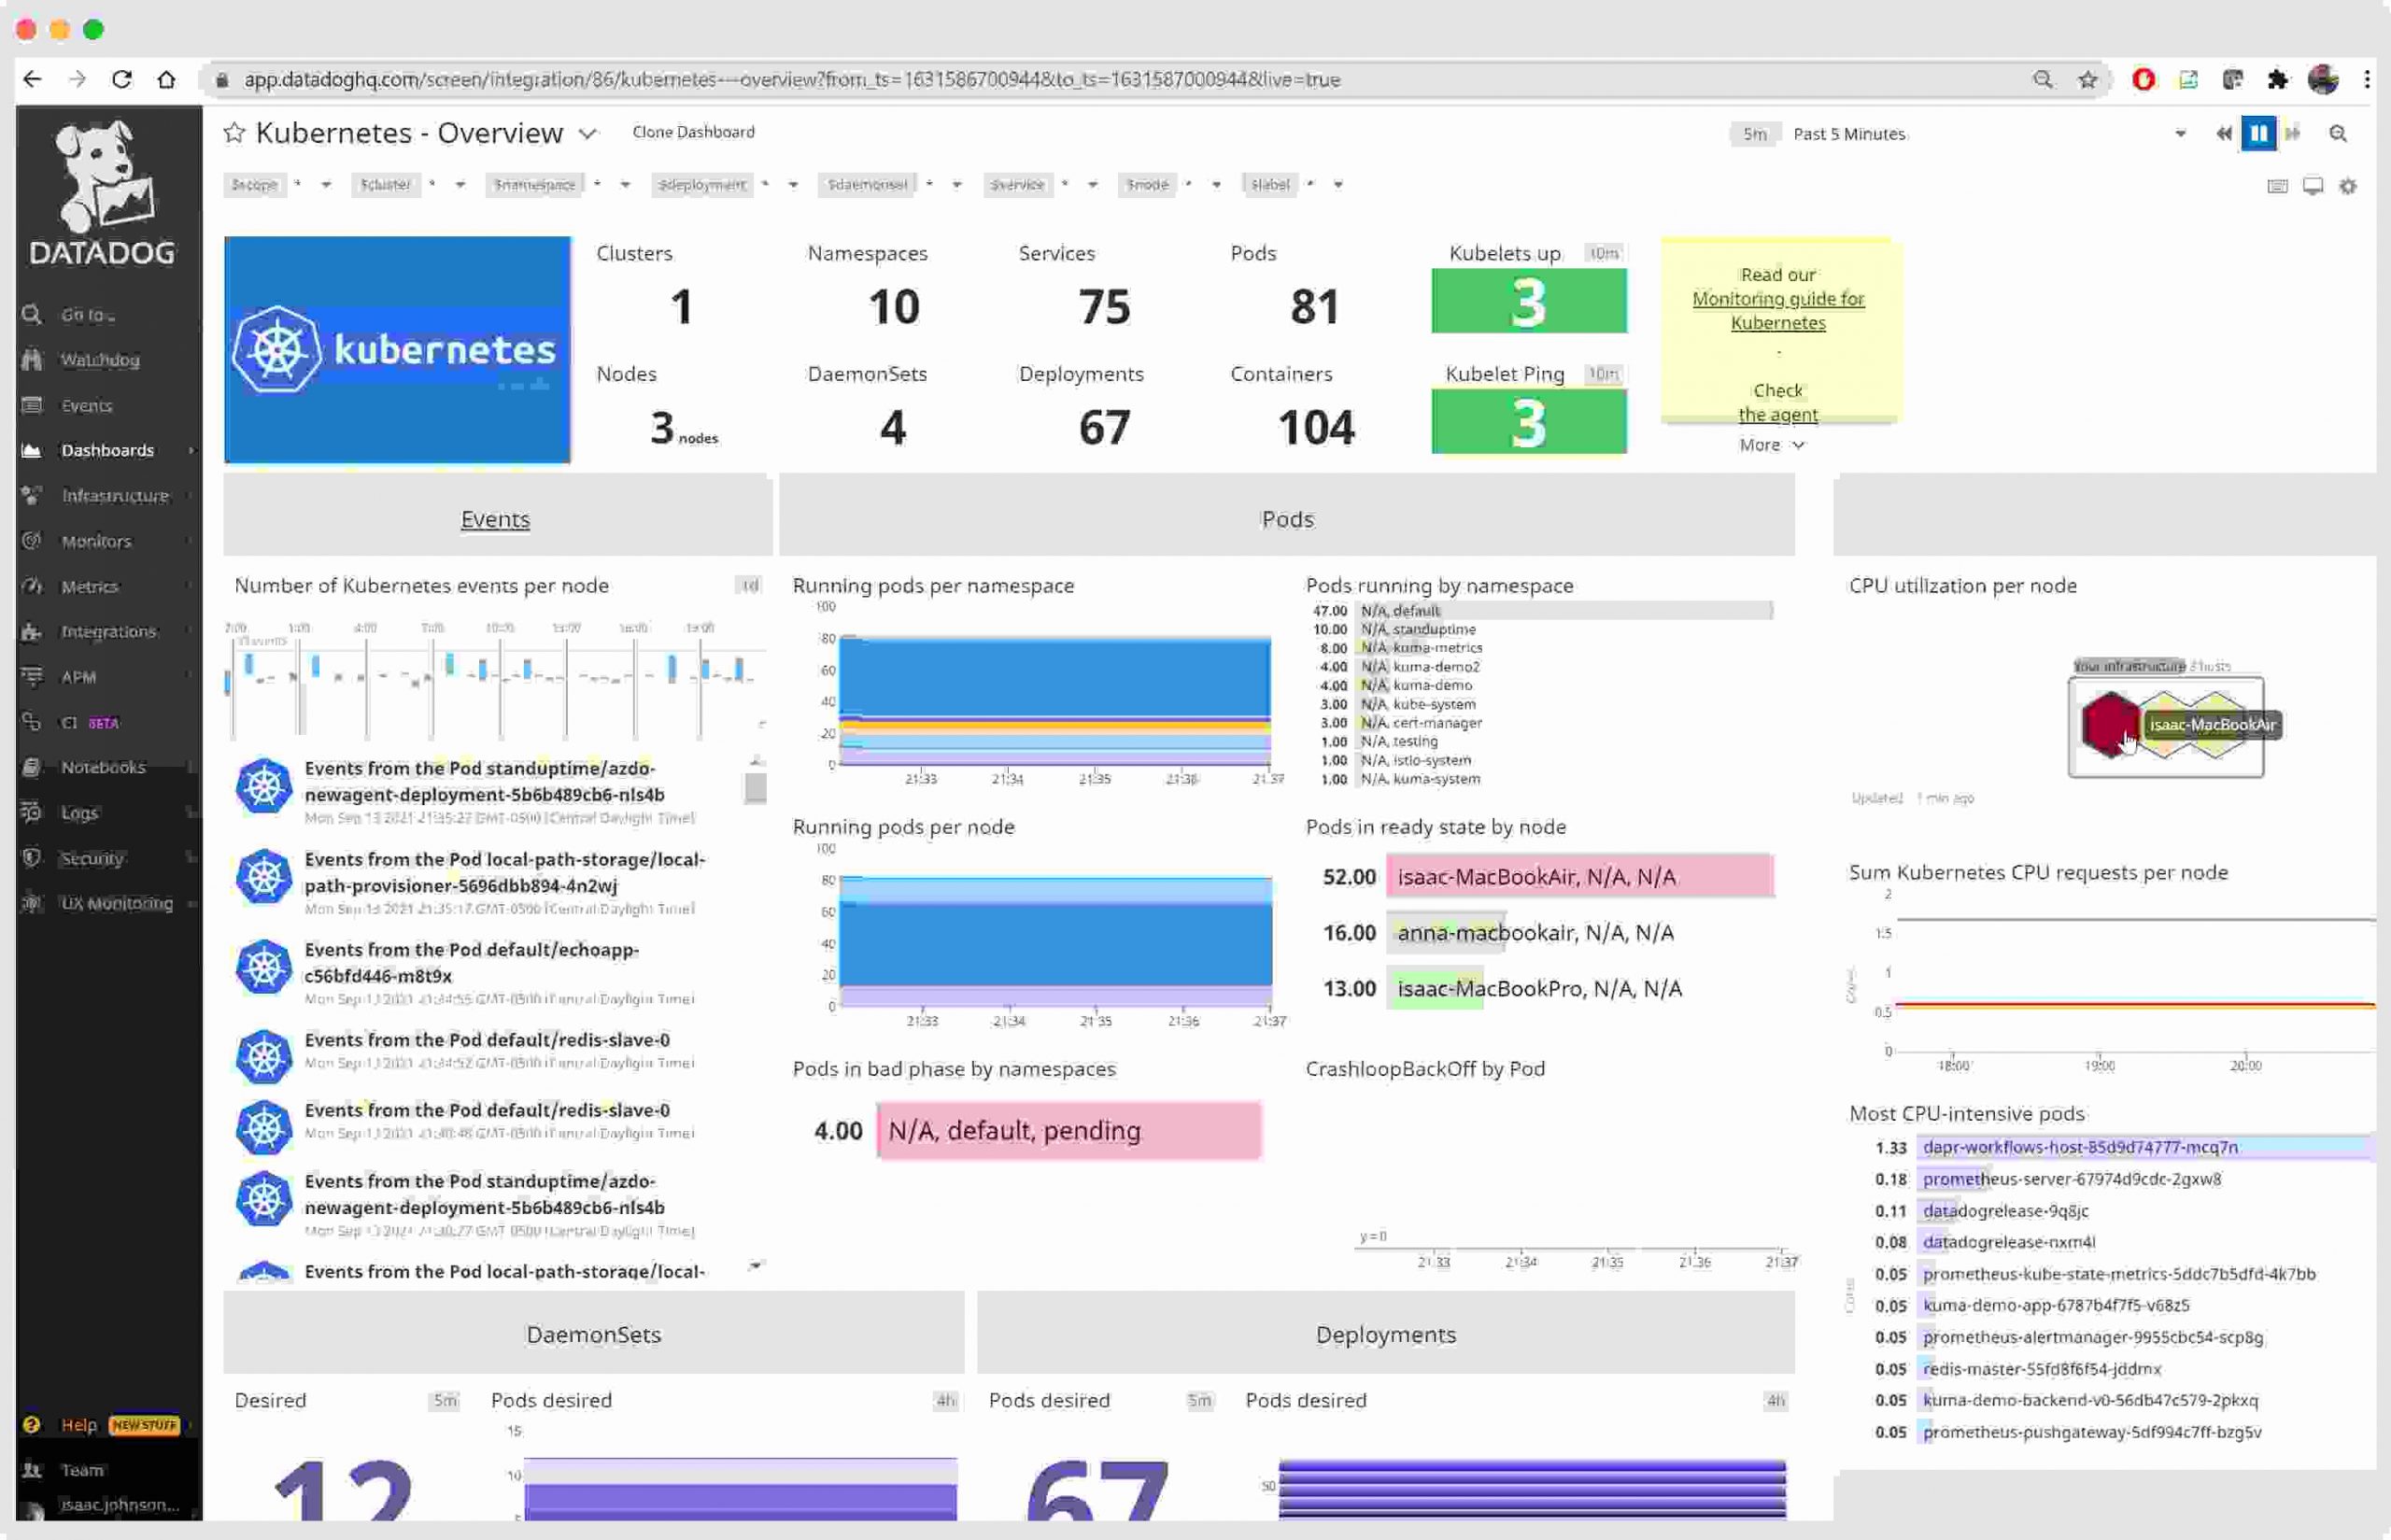
Simple pre-configured connectors with some of the most popular platforms, including AWS, GCP, Alibaba Cloud, and Azure, are available. Over 400 more platforms and services, such as Slack and PagerDuty, have been integrated. Datadog also provides strong API access for developers who need to consolidate data from custom-built apps.
Features:
- Monitoring cloud application performance with a wide variety of connectors and support for distributed tracing.
- Centralization and analysis of logs.
- Monitoring of real users and synthetics.
- Monitoring of the network and hosts.
- The dashboard architecture enables the creation and sharing of nearly. anything using the metrics and logs supplied.
- Machine learning skills for alerting.
- Collaboration software for group conversations.
- API that allows you to interact with data, tags, and dashboards.
Pros:
- All-in-one observability system, including metrics, logs, security, real-world users, and synthetics.
- Hosts, containers, processes, networks, and serverless capabilities are all monitored as part of the infrastructure.
- Applications, containers, cloud providers, clients, and common log shippers are all included in the rich logs integration.
- Data analysis tools that are both powerful and adaptable, with alerts and bespoke dashboards.
Cons:
- For newbies, the installation process for anything beyond basic metrics might be overwhelming.
- NetFlow data is not automatically included.
Pricing:
Datadog’s pricing is structured to cater to varying needs. It startes with a 14-day free trial with limited features. It’s Pro Plan starts at $15 per host per month and supports up to 1,000 hosts and includes 13 months of data retention, custom metrics, and email support. Advanced enterprise-specific features, such as application performance monitoring and extended log retention, are available under the Enterprise Plan with custom pricing based on usage.
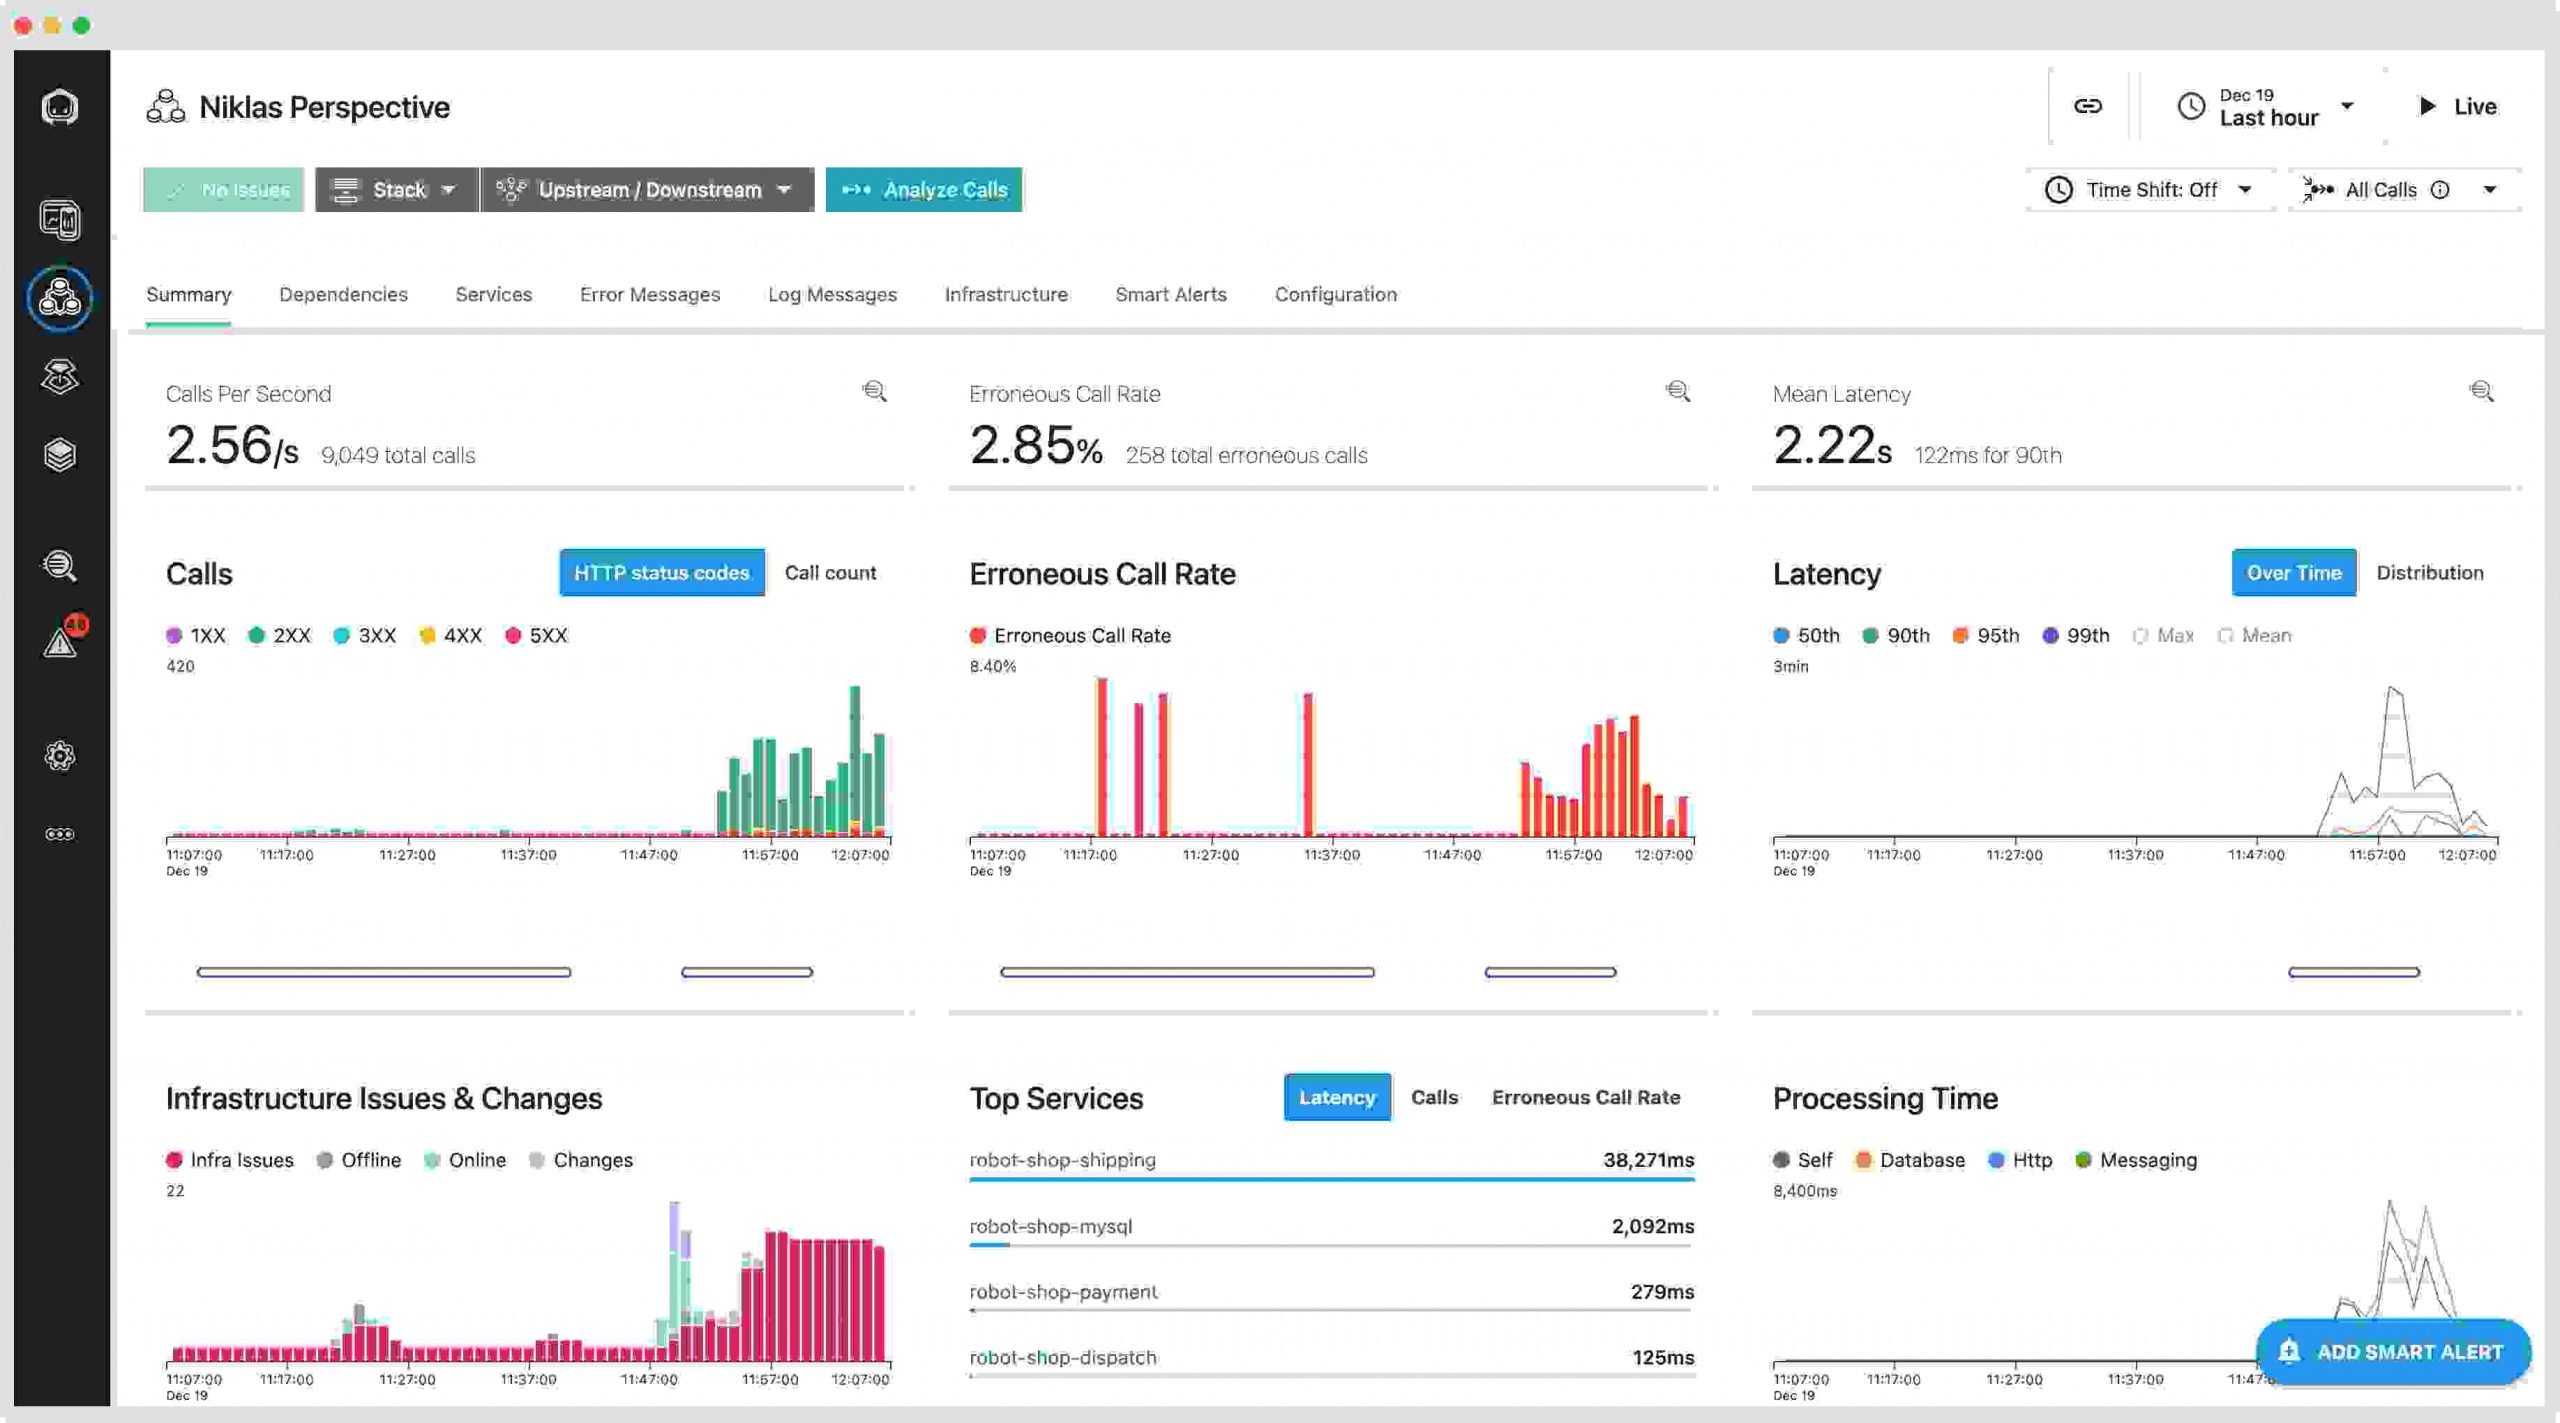
8. Instana
All services, infrastructure, and interdependencies are automatically discovered and mapped by Instana’s Enterprise Observability Platform, which is driven by automated Application Performance Monitoring.
Instana by IBM ingests all observability metrics, traces each request, profiles every process, and updates application dependency maps in real-time to provide Dev+Ops with the context and actionable feedback they need to improve application performance, enable innovation, and mitigate risk, allowing them to add value and efficiency to the pipeline.
Features:
- Relevant metric collecting is fully integrated into the Instana Dynamic Graph.
- Behavioral learning with full AI support.
- Every request generates a trace.
Pros:
- Keeps 100% of Trace requests.
- Simple query interface.
- Easy to integrate.
- Insight into RCA.
Pricing:
Instana’s pricing structure is primarily based on a per-host, per-month model, billed annually, with two main plans: Observability Essentials and Observability Standard.
Pricing for the Essentials plan starts at an estimated $18 per host per month for core features such as infrastructure discovery, 1-second monitoring granularity, and container orchestration monitoring. The Standard plan includes all Essentials features but adds advanced capabilities like code-level visibility, distributed traces, log management, and real-time change detection.
Instana also offers add-ons for specific functionalities:
Synthetic Monitoring:
- $3 per 10,000 API executions (Simple API Test).
- $5 per 10,000 API executions (Script Test).
- $12 per 1,000 browser executions.
Advanced Log Retention:
- 30-day retention: $350 per 1,000 GB per month.
- 60-day retention: $420 per 1,000 GB per month.
- 90-day retention: $490 per 1,000 GB per month.
Instana enforces a fair-use policy for data ingestion, with monthly limits of 50 GB per host on the Essentials plan and 325 GB per host on the Standard plan. Additional data ingest capacity can be purchased as needed.
9. SolarWinds
SolarWinds Network Performance Monitor is simple to install and use and can be up and running in no time. The utility detects network devices automatically and deploys them within an hour.
Its straightforward approach to network management makes it one of the most user-friendly and intuitive user interfaces available.
The product is very adaptable, and the user interface is simple to administer and update. The web-based performance dashboards, charts, and views may all be customized.
You may create a custom topology for your entire network infrastructure and develop personalized dependency-aware intelligent warnings.
Features:
- Automatically discover and scan networks for both wired and wireless computers and devices.
- Forecasting & Capacity Planning for a Wide Range of OEM Vendors. You can quickly pinpoint network performance issues with the NetPathTM Critical Path visualization function.
- Analyze critical data points and pathways throughout your network with an easy-to-use performance dashboard.
- Robust Alerting System with Simple/Complex Trigger Options.
- With their New Network InsightTM for CISCO ASA, you can keep an eye on your CISCO ASA networks.
- Monitor your Cisco ASA’s ACLs, VPN, Interface, and Monitor.
- Firewall Rules is a tool for monitoring firewall rules. Analysis of Critical Network Paths and Components in the Browser.
- Discover and map networks automatically, including topology views.
Pros:
- Supports auto-discovery, which generates real-time network topology maps and inventory lists based on devices that join the network.
- Has some of the greatest alerting features, balancing efficacy and usability.
- Supports both SNMP monitoring and packet analysis, offering you greater monitoring flexibility than comparable solutions.
- Customizes the look and feel of the dashboard by dragging and dropping widgets.
- There are several pre-configured templates, reports, and dashboard views available.
Cons:
- Non-technical users may find some capabilities overwhelming because this is a feature-rich corporate solution built for sysadmins.
- There isn’t a lot of integration with third-party products.
Pricing:
SolarWinds offers a 30-day fully functional trial. After that, the pricing depends on the number of devices and the level of support required.
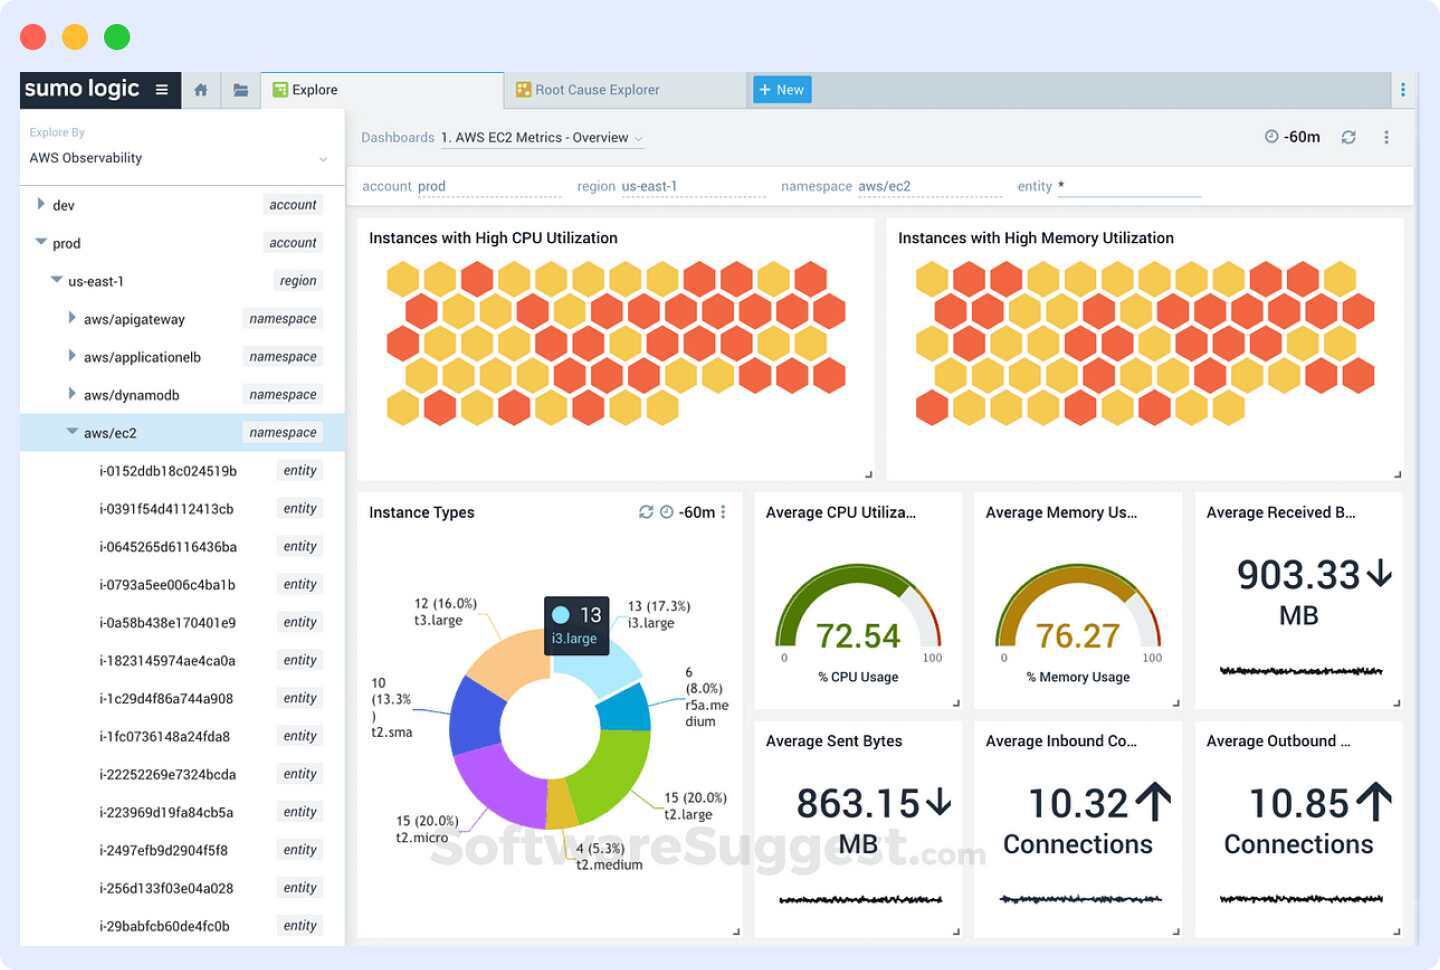
10. SumoLogic
Sumo Logic is a cloud monitoring platform that focuses heavily on working with logs and excels at it. With tools like LogReduce and LogCompare, you may not only see logs from a certain time period but also decrease the amount of data you need to study and compare periods to identify intriguing inconsistencies and abnormalities.
When combined with analytics and security, you have a powerful tool for monitoring your environment.
Features:
- Log analysis using the LogReduce technique allows you to cluster similar messages, and LogCompare allows you to compare data from two different time periods.
- Field extraction allows the researcher to extract data from unstructured data using rules.
- Monitoring application performance using real-time alerts and dashboarding
Scheduled views to run your queries regularly. - With PCI compliance and integrated threat intelligence, cloud security capabilities for typical cloud providers and SaaS solutions are available.
Pros:
- Sumo Logic offers free product certifications and training.
- Real-time analytics and alerts are simple to set up.
- Dashboards and graphs that are visually appealing.
Cons:
- Some analytic capabilities, particularly low-level log data analysis, are limited by Sumo Logic’s query language.
- When loading dashboards or running large queries, there are performance difficulties and slowdowns.
- All log sources are missing support.
Pricing:
Sumo Logic offers multiple pricing plans that serve an array of business needs.
- Enterprise suite: Pricing is customized based on usage, offering a flexible plan for large-scale deployments.
- Free trial: Available for a limited time, allowing you to test the platform’s features.
- Essentials: Pricing starts at a custom rate per GB analyzed per month, depending on your specific needs.
- Enterprise operations: Custom pricing for this plan, which includes additional features and support.
- Enterprise security: Also has custom pricing, with advanced security features and support.
5 Open-Source Cloud Monitoring Tools
If your IT department is looking for low-cost, no-lock-in cloud monitoring tools, open-source may be the way to go. Let’s look at three prominent open-source cloud choices.
11. Zabbix
Zabbix is a tried-and-true open-source cloud monitoring tool with very configurable setups that was first launched in 2001. It can employ agents to collect cloud monitoring data, which might be handy for monitoring cloud-based VMs. It also interfaces with Amazon CloudWatch to gather metrics from cloud environments directly.
Zabbix may be tricky to set up, especially when it comes to monitoring cloud settings. It was created long before the cloud was a thing; therefore, it wasn’t meant to be easy to set up as a cloud monitoring platform. Zabbix’s scalability is similarly limited: it can only support 1,000 nodes.
Zabbix is an excellent choice if you require a highly customized monitoring solution for small to medium-sized cloud setups.
12. Nagios
Nagios and Zabbix have a lot in common. It’s been around for about two decades, so it’s a reliable open-source cloud monitoring tool. It also provides the same amount of setup and data collecting options.
The fact that Nagios comes in two flavors is a significant distinction. Nagios Core is free; however, Nagios XI is a commercial platform with more functionality and better usability.
There is just one version of Zabbix. If you believe you’ll require more functionality than the free platform, Nagios’ dual-version strategy can be appealing. Start using Nagios Core and upgrade to Nagios XI later if necessary.
13. Icinga
Consider Icinga if you need more functionality than Nagios Core provides but don’t want to upgrade to Nagios XI. Icinga, a fork of Nagios, was founded in 2009 and includes many of the same functionality as Nagios Core, as well as additional features to simplify monitoring and boost usability, such as a more simple UI.
Icinga does not interact directly with most cloud services, which might be a major reason to avoid it. For example, you can’t get data directly from CloudWatch. Instead, Icinga imports data from cloud workloads, such as virtual machines.
This is acceptable if your cloud environments are largely made up of simple components like VMs, but it’s inconvenient if you need to track other cloud services.
14. Grafana
Grafana is a monitoring tool created for the cloud era. Technically, Grafana is a visualization tool because it doesn’t collect data on its own. It integrates with other technologies and tools to collect and present the data that makes sense for you.
Grafana offers a great deal of freedom in terms of choosing a data collector, so even though this may initially appear to be a constraint, it is actually a strength in many ways. You may either get it directly from cloud service providers (like AWS, and GCP) or utilize another open-source tool like Prometheus.
The major drawback of Grafana is that it struggles to compare data from different clouds or a hybrid cloud. One data source can only have data displayed at once in Grafana. Multiple data sources can be combined and interpreted simultaneously, although doing so necessitates the use of custom queries.
25. Pandora FMS
Pandora FMS is an all-in-one monitoring solution that is 100% OpenSource under GPL2 license. It helps users monitor servers, networks, UX, applications, distributed environments, and much more.
With over 500 integrations, the software supports production environments of all kinds, regardless of the kind of technology it’s running on.
Why do you need cloud monitoring?
In IT, It’s a rule of thumb that engineers monitor everything that directly or indirectly impacts success, be it low-level performance metrics such as server-side logs or high-level performance indicators like CPU utilization.
When it comes to cloud monitoring, here are the reasons why you need to monitor them:
Data spreads across distributed locations: With cloud monitoring, you can always ensure that your data is secure, available, and accessible to the right person at the right time. This is especially valuable for global companies with data flowing across distributed, multi-cloud environments.
Breachers are inevitable: Cloud assets are the biggest target for cyberattacks. In fact, over 39% of businesses have experienced a breach on some level in 2023. Cloud monitoring can help you avoid such issues by allowing engineers to pinpoint suspicious activity and take action immediately.
Compliance isn’t a choice: Cloud Technology is ubiquitous today, even in the most stringent industries such as Finance, Government, and Healthcare. With proper cloud monitoring, you can always ensure that you are compliant and avoid any penalties.
How to choose the best cloud monitoring tools
When choosing cloud monitoring tools, ensure the product you choose fits a few important criteria to ensure compatibility and value. The following are some critical requirements to consider.
1. Provide end-to-end tracing
Because cloud apps, users, and resources are dispersed, you must monitor a much larger number of components than traditional infrastructures. Look for software that can consolidate and correlate data from several systems while also providing end-to-end tracing.
2. Offer Cloud Integrations Natively
Ideally, seek products that can interface seamlessly with your current systems and suppliers. You add more points of failure the more agents, plugins, or custom integrations you need to incorporate. If a component is updated, you risk losing compatibility.
3. Pricing model
Traditional on-premises cloud monitoring tools are frequently charged based on the number of devices or users that will be monitored. Because of the changing nature of cloud resources, this price system does not perform effectively. Look for alternatives that allow you to float charges from month to month or have variable pricing.
4. Scalability
When you combine cloud settings with the Internet of Things (IoT) or other streaming devices, you get a lot of data. Especially with customer-facing apps and services, user volumes might vary. Any monitoring solution you use must be able to handle the massive volumes of data generated by your workloads and users.
Conclusion
These cloud monitoring tools can assist you in acquiring observability data, but they take different approaches, offer different functions, and have varying prices.
Depending on your use case, some solutions, like Middleware, may be a better fit than others, so test out a few and pick the one that best suits your needs. If you already have made a choice, sign up on our platform to see it in action!
FAQs about Cloud Monitoring tools
What is cloud monitoring tool?
A cloud monitoring tool collects observability data from your whole IT infrastructure and helps you monitor and track the performance of your application in distributed environments.
Why do we need cloud monitoring?
We need cloud monitoring because when offering services to consumers, you must monitor everything that might influence your success, from low-level performance metrics (like server-side logs) to high-level business key performance indicators (like CPU utilization).
How do I monitor my cloud application?
There are a few ways to monitor your cloud application:
- Use monitoring tools like Middleware to monitor your cloud application
- Use monitoring tools that can be installed in your on-premise infrastructure for your agentless cloud application.
- Use logging tools such as Loggly, Middleware, Papertrail, and LogChief to track application logs.
Any of these tools can provide real-time insight into how your app is performing and what’s causing issues. They can also help you identify trends that could point you in the right direction for resolving performance issues.
What are the best cloud monitoring tools?
The best cloud monitoring tools often depend on specific requirements such as the type of cloud infrastructure you’re using, the scale of your operations, and the features you prioritize. However, here are some popular choices across different categories: Middleware, Datadog, NewRelic, Grafana etc…